Bloomberg Market Specialists Steven Gee, Isabel Linder and Jacqueline Galvez Rodriguez contributed to this article. The original version appeared first on the Bloomberg Terminal.
Single bond trades—transacted by traditional buyers and sellers using Bloomberg IB chats, MSGs, the telephone, and electronic trading platforms—have been the cornerstone of the corporate bond trading world. Broker-dealers provide market-making liquidity, relying on carefully crafted market color and axed pricing, to facilitate these trades. Each trade represents a valuable chit in building collaborative relationships.
For credit investors, though, the challenge of outperforming peers is harder in the current environment of low yields, narrow credit spreads, and benign credit riskthat’s been caused, in part, by the market perception that the Federal Reserve has “got your back.” What’s more, if your portfolio is supersized, shifting strategies in a short time frame—whether that’s changing sectors, issuers, or duration buckets—is increasingly difficult to do without loudly telegraphing your intentions to the market.
What’s resulted is a special sandbox venue of the market—portfolio trades—in which market participants with large holdings can horse-trade their bond positions with one another. It’s reminiscent of before the financial crisis, when banks were still permitted to sling around large positions, using leverage and their huge balance sheets to make markets. These days, this sandbox is limited to market players who have the capital, risk appetite, and distribution to efficiently price portfolios of bonds, trade them at competitive prices, and generate some profit from the transaction. Easier said than done. To accomplish it, you first need to win the portfolio trade away from other eager behemoths.
To get a step ahead of the competition, use Bloomberg’s Portfolio & Risk Analytics (PORT) to assess the risk on a portfolio of corporate bonds, followed by Bloomberg’s Fixed Income Worksheet (FIW) to analyze relative value of the portfolio constituents. To find the different ways to use FIW for your analysis, learn more here.
Load your list
As soon as you receive the list of bonds, you can analyze them by dragging and dropping the Cusips and par amounts into a portfolio created in the Portfolio Administration (PRTU) function.
To start, type “portfolio administration” in the command line of a terminal screen and select PRTU – Portfolio Administration from autocomplete. The shortcut is PRTU <GO>. PRTU will display a list of any portfolios you’ve previously created. Click on the Create button on the red toolbar. In the Create Portfolio window that appears, give the portfolio a name. Set the Asset Class to FI. For benchmark, you can select None or choose another portfolio to benchmark against. Bloomberg Anywhere users can select from the Bloomberg Barclays indexes found in the Benchmark field. Click on the Create button. In the screen that appears, change the Date to 06/30/20, so you can perform historical analysis dating from the end of last year’s second quarter.
Next, go back to your bond spreadsheet. For easier copying, make sure the par value column is just to the right of the Cusip column. Then select all the Cusips and par values and hover your cursor over the border of the selected area so the move pointer appears. Left-click to drag and drop into the amber field below Cash in PRTU. (If you get a notice saying “the picture is too large and will be truncated,” click on OK, and the import should proceed.) Once the bonds have been loaded, click on Save.
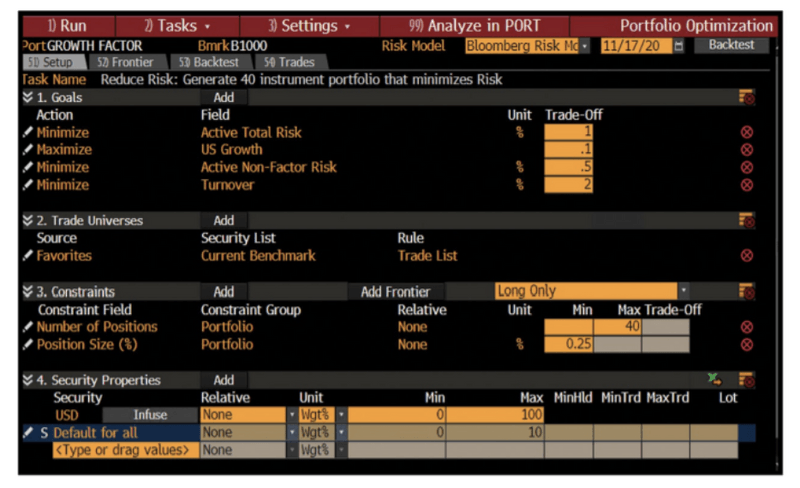
To create a portfolio from a list of bonds in Excel, run PRTU <GO> and click on Create. Give the portfolio a name, select FI as the Asset Class, and click on Create. For history from the end of the second quarter last year, enter 06/30/20 in the Date field.
Pro tip: After you save the portfolio, you’ll have access to it in other Bloomberg workflows in addition to PORT and FIW.
You can input your own custom pricing in PRTU by entering the data in the Price column. By default, PORT uses BVAL to price fixed-income instruments. If you’re a PORT Enterprise user, you can override BVAL. You can also enter a price if no BVAL pricing is available for a security. If you use custom pricing, the calculation profile in PORT needs to be adjusted to take that into account.
Analyze in PORT
Once you’ve made any adjustments to bond prices and position sizes, hit Save and click on the Analyze button on the red toolbar to load the portfolio into PORT. PORT enables you to perform analysis to better understand the portfolio’s holdings. It can explain the drivers of performance, identify potential sources of risk, and compare your list with other portfolios or indexes.
Click the Characteristics tab and the Main View subtab to dig into underlying portfolio risks, issuer concentration, or individual bond impact on the portfolio. Customize the columns to analyze duration, credit quality, yield, and spread as of a specific date. Tick the radio button to the left of Trend to see a time series of a given field.
To quickly uncover the tenors that contribute the most interest-rate risk to the portfolio, click on the Key Rates subtab. You can display the option-adjusted duration (OAD) at the aggregate level or drill down to the security level.
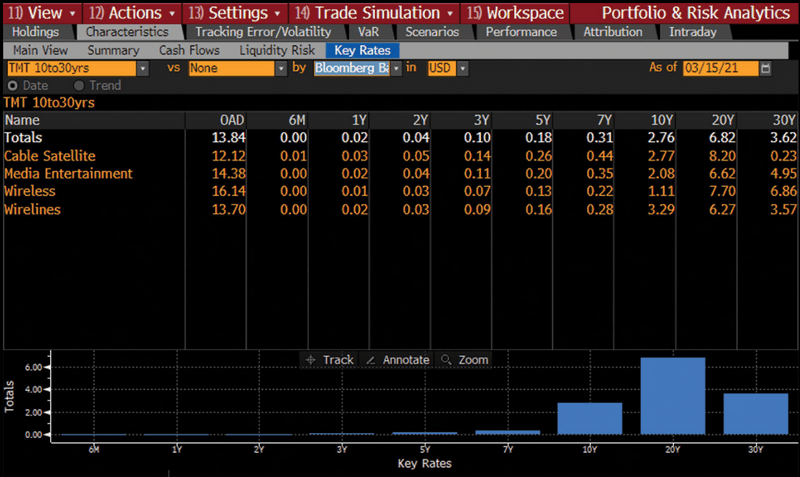
Load the portfolio into PORT to analyze it. To see which tenors contribute the most interest-rate risk, select the Characteristics tab and then click on the Key Rates subtab.
To better understand each bond’s weight in the portfolio, click on the Holdings tab and then on Allocation. Use the drop-down to the right of By to select a classification, and you can analyze your portfolio’s exposure to a given sector, country, or rating. The bar chart on the right-hand side displays the distribution of your holdings at the aggregate or security level.
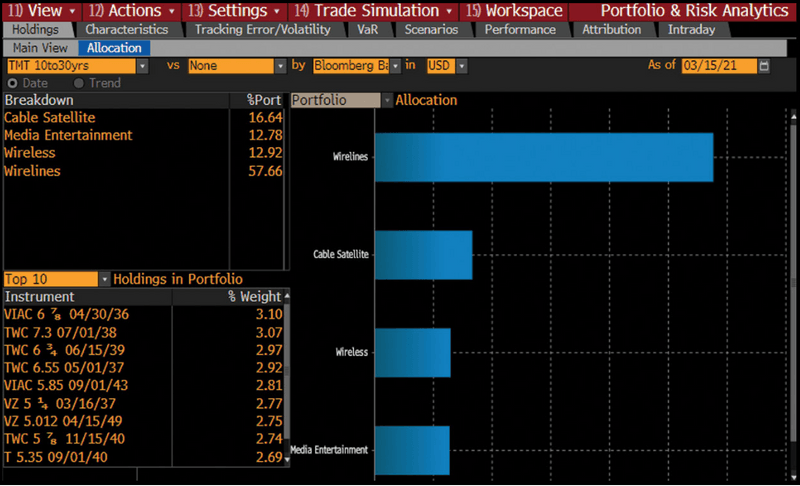
Click on the Holdings tab and then on the Allocation subtab to dig into bond weights in the portfolio. The bar chart displays the distribution of weights at an aggregate or security level.
FIW and Relative Value
Next, let’s load the same portfolio in FIW. Run FIW <GO>, click into the amber field in the upper left corner of the screen, and select Browse … . Under List Sources, click on Portfolio and select the one you saved earlier. Under the Matrix tab, you can organize the bonds in the portfolio by a primary and secondary grouping. Use the first drop-down next to Group By to choose the primary grouping. Select Issuer, for example, to group the bonds in the list by issuer. Use the second drop-down for your secondary grouping.
To see your entire bond universe broken down by your primary grouping, click on the Bond List tab and then on the Pricing subtab. Tick the box for Calc Mode, and the pricing, benchmark spread, and other spread and yield fields become interactive, like they are in the Yield and Spread Analysis (YAS) function.
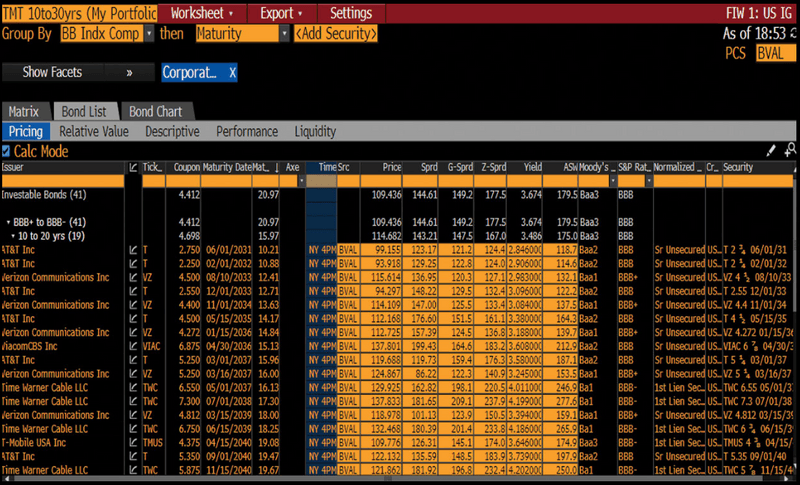
To load the portfolio into FIW, run FIW <GO>, click into the field in the upper left corner of the screen, select Browse …, and navigate to your saved portfolio.
To further filter, click on the >> to the left of Show Facets if the Facets panel isn’t already open and select a facet, such as BCLASS Level 4: Wireless, to drill down to the securities in that sector.
Click on the Relative Value subtab to perform your relative value analysis. See whether particular bonds are rich or cheap based on a selected variable such as G-spread, option-adjusted spread, or yield over a particular time period. The range chart allows you to see a bond’s present value in relation to its historical average and compare the performance of bonds across the portfolio.
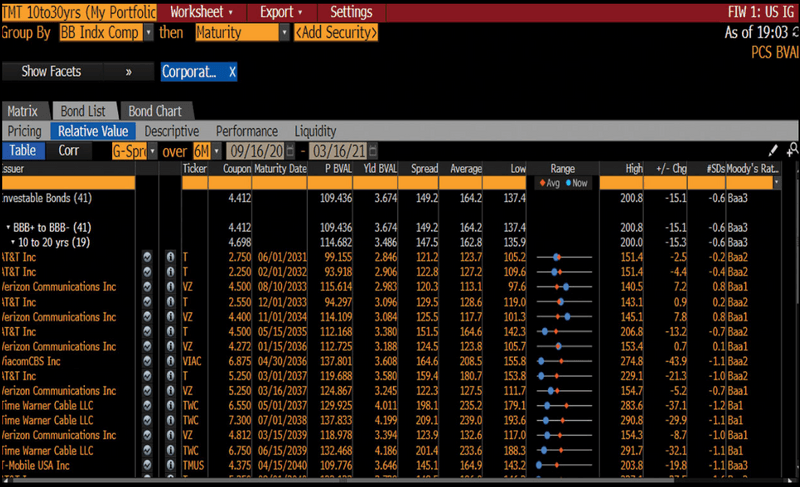
To perform your relative value analysis, click on the Bond List tab and then on the Relative Value subtab. The Range chart lets you see each bond’s current value in relation to its range and average over a specified period.
To visualize the bonds in the portfolio based on criteria you specify, click on the Bond Chart tab. To add a custom regression curve, click on the white curve icon to the right of All Bonds. You can then click on the curve icon for issuers you’re interested in. When we charted a list of technology, media, and telecommunications bonds by G-spread and duration in mid-March, for example, you could easily identify Time Warner Cable, AT&T, and Verizon bonds by their issuer curves, so you can get a sense of their relative steepness. Alternatively, to search for the entire issuer curve of an entity to see how the selection of bonds in the portfolio from an issuer compares to its entire bond universe, type the name in the Add a Curve field and click on the match.
To see which securities have tightened in comparison to the others, use the Axes: Y drop-down to select More … . In the Customize Spread window, select G-Spread, Change, and over the past 6 months. Hit Close.
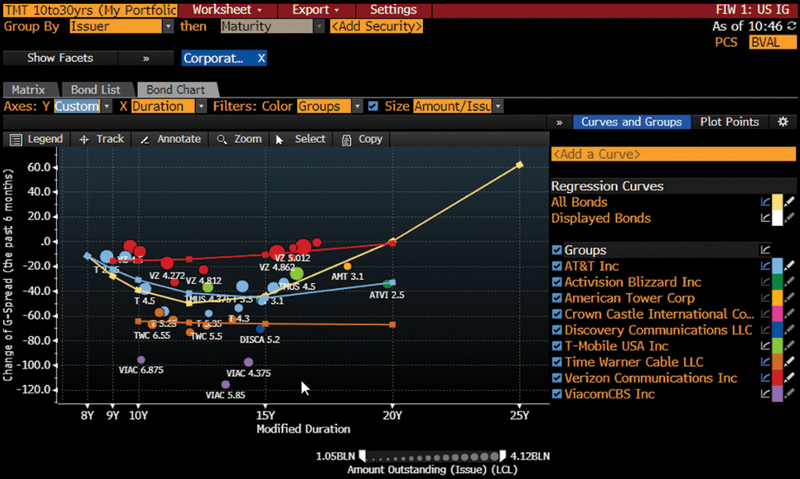
To visualize the portfolio bonds based on criteria you specify, click on the Bond Chart tab. To chart changes in the G-spread over the past six months, use the Axes: Y drop-down and select More…
Visualizing the widening or tightening of bonds over recent months can help you provide market color and frame future spread movements if you win the portfolio trade.
Understanding recent spread movements allows you to effectively price the portfolio and ensure that you have sufficient profit opportunity to weather spread volatility if you hold the securities for longer than expected. Based on your observations here, you can revert to your PORT portfolio to adjust pricing for individual bonds.
After updating the pricing for these securities in PORT, choose to finalize your portfolio pricing so you can share your indicative pricing of the portfolio with your trading counterparty. You can export directly from PORT by clicking on the Actions button, selecting Generate Report, and choosing from Excel or PDF formats.