Predicting Value-at-Risk in times of financial crisis
Amidst the current market turmoil due to the COVID-19 pandemic, it is timely to examine the performance of different Value-at-Risk (VaR) models over the long-term and in previous times of crisis. Using the S&P 500 daily returns going back to the crash of 1929, the one-day VaR predictions at the 95% and 99% confidence levels for four models available in Bloomberg’s Portfolio & Risk Analytics (PORT) solution are analyzed in this article. This study uses daily returns for the S&P 500 from Jan 3, 1929 to Mar 16, 2020 to estimate VaR. Though there is no complete set of PORT factor returns going back to 1929, the PORT methodology can be mimicked using only the index returns since the VaR estimates are dominated by the market factor, and the S&P 500 returns are an excellent proxy for market factor returns.
Two types of Tail-Risk models available in PORT are considered: Monte Carlo VaR and Historical VaR. For the Monte-Carlo VaR estimates, an exponentially-weighted moving average (EWMA) is used to determine the factor volatilities. The EWMA method’s key parameter is the half-life: this determines how heavily weighted recent history is in estimating volatility. Three different half-life values available in PORT are used: 11 day, 21 day, and 126 day. 1Y Historical VaR is looked at (PORT also offers 2Y and 3Y Historical VaR, but these methods were quickly found to be inferior so were dropped from further consideration). Thus, four models are compared:
- Monte-Carlo VaR with an 11D EWMA Half-life – referred to as model “11D HL”
- Monte-Carlo VaR with a 21D EWMA Half-life – referred to as model “21D HL”
- Monte-Carlo VaR with a 126D EWMA Half-life – referred to as model “126D HL”
- 1 Year Historical VaR – referred to as model “HVaR (1Y)”
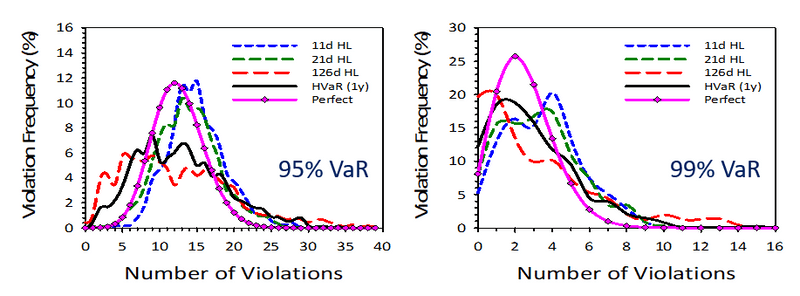
Predicted VaR is compared to the following day’s return of the index. When the return is worse than the predicted VaR, a “VaR Exceedance” or “VaR Violation” is obtained. The violations are counted and the percentage of violations is compared over the past 250 days to the ideal level: 5% for 95% VaR, and 1% for 99% VaR. This is done each day, so a rolling count of violations over overlapping 250-day windows is available. For 95% VaR, it is desirable to see 12.5 violations out of 250 days (5% of 250). However, even a perfect VaR model will not produce 12.5 violations in every 250 day period. For a perfect model, the distribution of violation frequency is determined by the Binomial Distribution, as the number of violations deviates from 12.5 due to sampling error.
Distribution of violation frequency 1929-2020
Overall, the 21D HL model provides the best overall forecasts for 1D VaR at both the 95% level and 99% level.
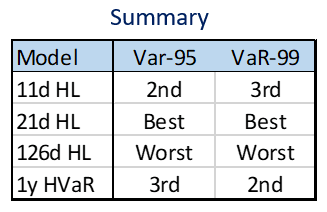
The advantage of 21D HL is more pronounced at the 95% level, but persists at 99%, with 1Y HVaR a close second there. This conclusion is reached based on the 21D HL line tracking the perfect model line more closely, especially at the extremes: near zero, and for many violations. 21D HL also performs best in tests using confidence bands, and Kupiec Test P-Values.
Violation frequency in crisis periods
Violation frequency over four crisis periods were observed, focusing on 2-month crisis windows: the crashes of 1929, 1987, 2008, and 2020. Focusing on recent events, the charts below show the 95% and 99% VaR levels from the four models over a 2-month period starting on Jan 23, 2020:
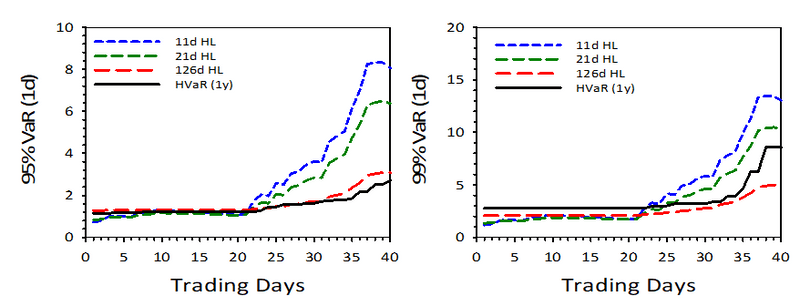
VaR was unusually low prior to the crisis and all VaR forecasts have risen dramatically since then. The 11D HL model ramps up the most quickly at both VaR levels, while HVaR (1y) is least responsive at 95%, since 12 extreme returns must be seen before 95% VaR responds. 126D HL is the least responsive for 99% VaR due to the long half-life. The charts below show the rolling number of violations over 250 day periods:
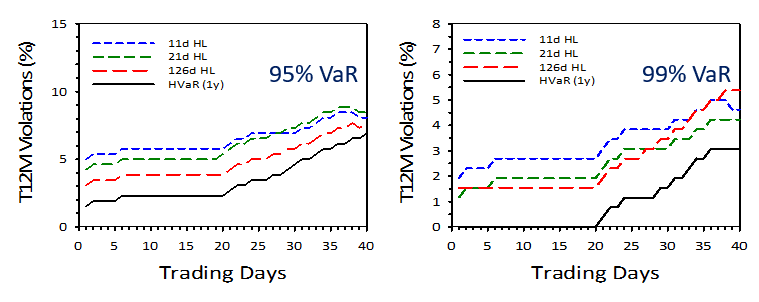
Prior to the current crisis, HVaR (1Y) was significantly over-forecasting VaR, with violation frequencies of 2% (95% VaR) and 0% (99% VaR). All models show signs of clustering, that is, a steep increase in violations, with 11D HL showing the least. HVaR (1Y) gets the least violations at both levels. This pattern plays out similarly in the other crisis periods, except for 1987, where the crash was concentrated in one day so it did not register in HVaR (1Y). In all four crises, 21D HL performs nearly as well as the HVaR (1Y) and 11D HL, which when coupled with it’s out-performance in non-crisis times, leads to a recommendation of its use for good times and bad.
To learn more about using PORT to forecast Value-at-Risk, please contact your Bloomberg PORT specialist.