Here are some key tools for exploring an investment idea
This was written by Bloomberg Equity Product Manager Adam Lynne. It originally appeared on the Bloomberg Terminal.
In a rare move, quant investing giant Dimensional Fund Advisors LP recently added a new factor to its equity strategies.
The characteristic? Investment, as measured by asset growth. Stocks of companies that invest a lot tend to under perform, Dimensional’s research found. The finding builds on academic work, including research by Nobel laureate Eugene Fama and his longtime collaborator Kenneth French. Both Fama and French are board members and consultants to the $609 billion-in-assets Austin-based firm.
According to an article on Dimensional’s website, the idea goes something like this: If a company buys machinery or takes over a rival, there are three ways it can fund those investments. It can sell stock, borrow, or retain earnings. All of those actions increase assets. (In the case of issuing debt, the rise in liabilities is matched by an equivalent increase in assets.) Hence, growth in assets can be a marker for investment.
Why isn’t investing a good thing? According to valuation theory, stock returns reflect the discounted present value of a claim on a company’s expected future cash flows. If a company has to invest more, that reduces the cash that ultimately should go to shareholders.
When Dimensional did a statistical analysis of U.S. large-cap stocks, it sorted them into deciles by year-over-year growth in assets from 1974 to 2018. The results are striking. The top decile, with the highest growth in assets, had a compound annual return of 8.7%. The bottom decile had a return of 14.2%—with a lower standard deviation of returns.
Until recently, the factor investing community had largely ignored these phenomena. To explore an investing idea such as this, here are some tools you can use.
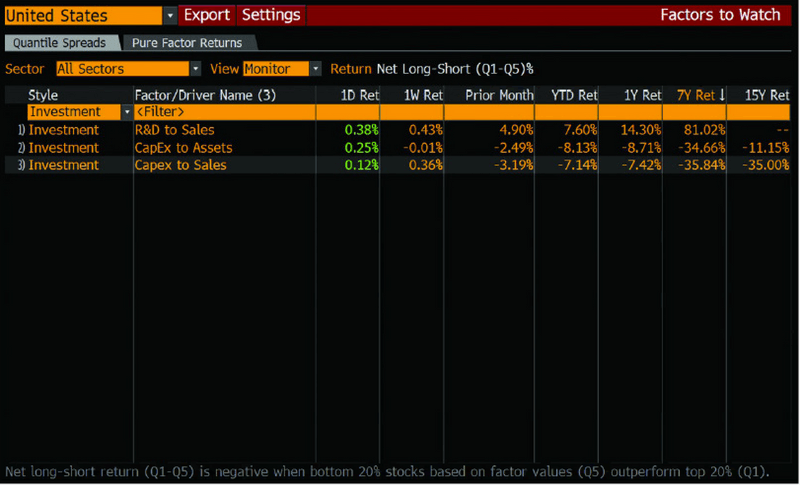
First, run {FTW GO} to open the Factors to Watch function. FTW lets you monitor the performance of factors intraday and dig into how they’ve driven returns historically. Let’s look at U.S. stocks. Use the drop-down in the upper left corner of the screen to select US United States if it isn’t already selected. By default, Sector should be set to All Sectors and View to Monitor.

Under Style, use the drop-down to select Investment, which displays three investment-style factors. The strongest was R&D to Sales, which generated an 81% return over the seven years through December. As these factor returns are calculated by going long an equal-weighted portfolio of the stocks that rank highest on a particular metric and short a similar basket of the lowest-ranked, this shows that U.S. stocks with high R&D spending as a percent of sales have outperformed those with low R&D spending by a cumulative 81% over the past seven years. By contrast, Capex to Assets and Capex to Sales both generated roughly -35% returns over this horizon, suggesting stocks with lower capex outperformed those with higher. This implies that a company’s method of investment can have a large impact on potential future performance.
(For another factor that’s similar to Dimensional’s, select All under Style, enter “5Y assets” in the field below Factor/Driver Name, and press GO. The 5Y Assets CAGR driver sorts companies by the compound annual growth rate of their assets over five years.)
So what does this mean for you? It could have implications for selecting external managers, deciding which sectors to overweight, or even choosing to be active or passive in specific industries.
Let’s zoom out to the big picture for a moment. Consider how certain industries have consolidated in recent years. Companies that have been gaining market share through acquisitions in their industry may appear to be strong investment candidates. (For the sake of argument, let’s set aside for now any awareness of how factors impact an investment.)
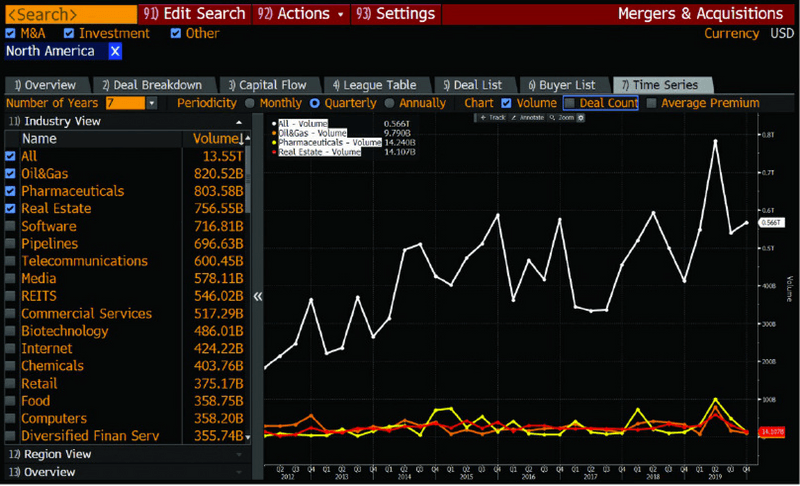
For an overview of deal activity in North America, run {MA GO} for the Mergers & Acquisitions function. In the Geographic Breakdown section of the screen, click on North America. Next, click on the Time Series tab, set the Number of Years drop-down to 7, and click on Industry View. In the sidebar that appears, you can see a ranking of industries by deal volume. The top three as of December were oil and gas, pharmaceuticals, and real estate.

OK, so which industry looks like it might provide the most investment opportunities?
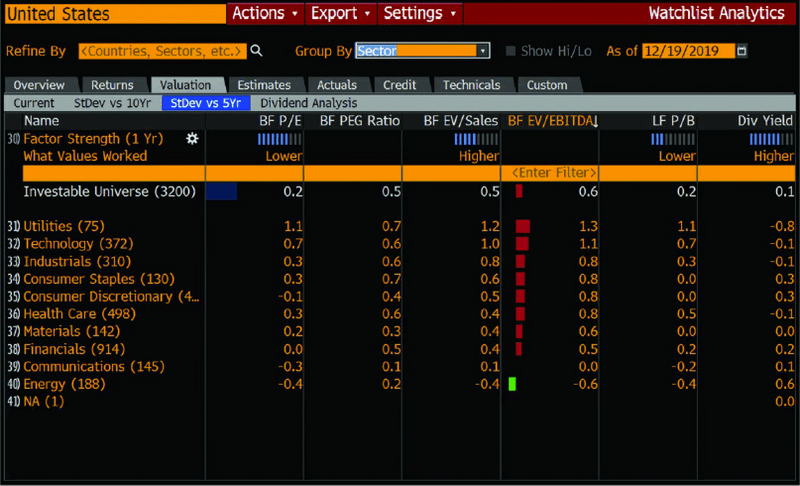
We may want to look at recent valuation discounts to find where a reversion to the mean could take place. To compare its valuation with those of other industries, go to {WATC GO} for the Watchlist Analytics function. Let’s look at U.S. stocks again. Click into the field in the upper left corner of the screen and select United States under Sample List (WATC Supported). For the Group By drop-down, select BICS Sector (or your default classification system, if you’ve previously changed your settings). Then click on the Valuation tab and on the StDev vs 5Yr subtab, which lets you see blended forward valuation metrics expressed as standard deviations from average historical levels.

The energy sector was trading at a discount of 0.6 standard deviations to its own historical EV/Ebitda valuation as of December. In other words, energy companies’ enterprise value — market capitalization plus debt minus cash — was significantly lower than has been typical in relation to earnings before interest, taxes, depreciation, and amortization. On a price-earnings basis, energy was 0.4 standard deviations cheap.
So energy appears undervalued. If you expect the sector to revert to more typical valuation levels, you might seek to take advantage of that potential move by getting passive exposure to energy. The premise: The total amount of investment in the industry, and its discounted valuation, will lead to positive future performance.
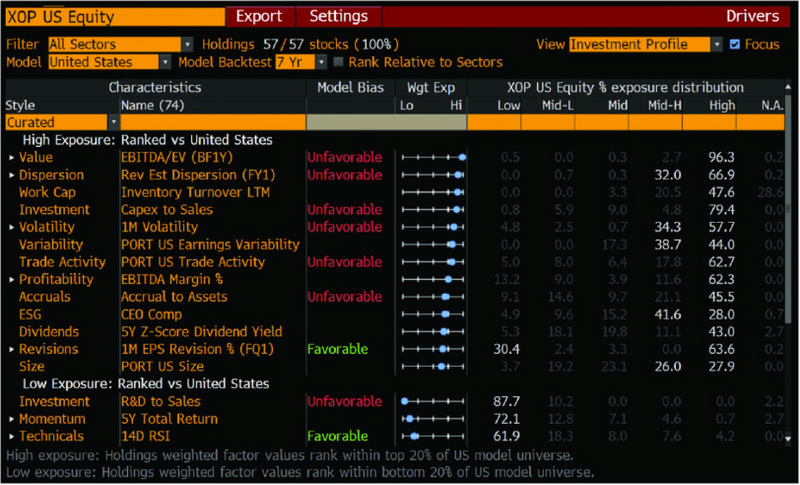
One of the most popular exchange-traded funds in the energy space is the $2 billion SPDR S&P Oil & Gas Exploration & Production ETF, which holds large-, mid-, and small-cap oil and gas stocks. To understand the specific characteristics these stocks have beyond their sector exposure, run {XOP US Equity DRIV GO} for the Drivers function. For the View drop-down, select Investment Profile if it isn’t already selected.

DRIV enables you to surface the characteristics and factors of a fund or portfolio, using a holdings-based approach. This analysis based on a fund’s current exposures is especially useful for confirming or refuting that a fund is following its stated stylistic mandate. DRIV also adds further context for the current exposures by showing how these prominent characteristics have backtested historically across the broader market in which a particular fund’s holdings are domiciled (in this case, the U.S.). In the Model Bias column, backtested characteristics are identified in three ways: Favorable, Unfavorable, or left blank if they are inconclusive.
Characteristics are broken into two categories: high — those in which the fund ranks high in exposure compared with other stocks in the same market — and low — those in which the fund ranks low. Metrics are ranked from highest exposure to lowest under the High Exposure header. You can see that Capex to Sales ranks fourth on the list. As of January, almost 80% of XOP’s holdings fell in the highest quintile for the factor when ranked against other stocks in the U.S. Since the highest quintile underperformed in the broader U.S. market over the default seven-year backtest horizon, the characteristic is flagged as potentially unfavorable for the ETF. (This analysis, of course, relies on taking history as indicative of future performance.) As you can see in DRIV, the ETF faces many other potentially unfavorable headwinds as well, which may explain its -11% performance in 2019.
When you’re researching a potential investment, intuition about desirable characteristics may not always line up with historical trends, and even passive investments can be impacted by unintended characteristics.
FTW and DRIV can help you spot such risks.