This was written by Bloomberg Intelligence analysts Noel Hebert and Anna Constantino. It first appeared on the Bloomberg Terminal.
Spreads of double A and double B rated corporate bonds are near the richest levels since at least the end of 2012 vs. other investment grade and high yield rating tranches, respectively. Historically compressed yields and spreads at a time of growing global economic uncertainty seem to have many creditors — who need to put money to work – seeking out the safest spaces.
Higher-rated high grade spreads richen amid great yield decline
Relative risk is being increasingly reflected in spread as declines in Treasury yields continue to erode compensation for creditors. Double A spreads are near their richest levels since at least 2012 vs. other investment grade rating tranches, though that’s partly due to the law of small numbers, as BBB yields got as low as 3.11% in early September.
Yield ratios rise, though not spread-led
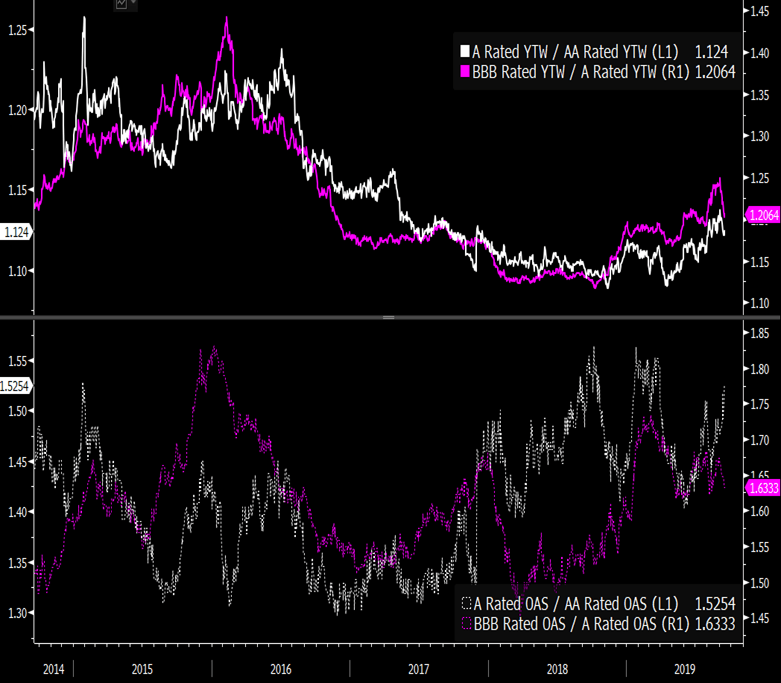
Spread ratios between double- and single-As have formed a 15% wide range in the past two years, with resistance at about 155% and support at 140%. By contrast, yield ratios have begun to rise after a long trough that saw the relationship reach the lowest levels in a decade this April. Volatility in Treasury markets, particularly the shift lower in the curve, has forced the yield relationship higher, and is likely to be the primary driver in the near term, even as we look for single A spread to enjoy a period of relative outperformance through year-end.
The theme holds true for the relationship between triple-B and single A as spread comprises a larger part of the total yield for corporates.
Spread ratios among investment grade tranches
Relative gains don’t erase BBB discount
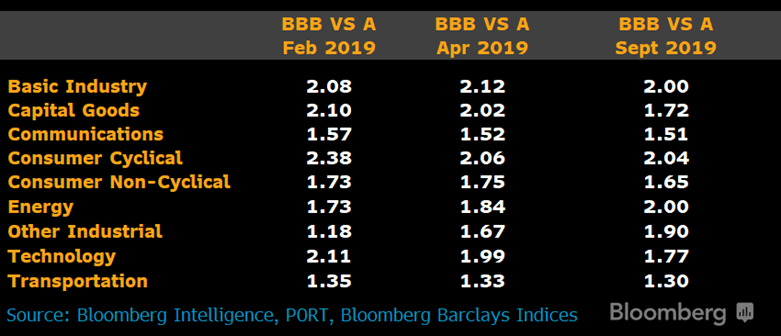
Option-adjusted spread (OAS) for single A rated corporates is tight to BBBs vs. intermediate and longer-term trends, though almost a standard deviation cheap on a year-to-date basis. That comes as risk appetite was restored early in the year after a relatively disorderly 4Q18 in which investment grade index OAS widened 47 bps. Triple Bs have paced the move, leaving most sectors within the rating tranche tighter vs. their single A sector equivalents, with energy an outlier.
The ratio between BBB and single A energy sector OAS has risen, climbing to 2x vs. 1.7x in February, though the move has more to do with stronger relative performance for the spread of single As, which has narrowed more off a smaller absolute number, as the sector is the second-best performer within BBBs.
BBB to A spread ratios by sector
Shorter tenors generally rich to rest of curve
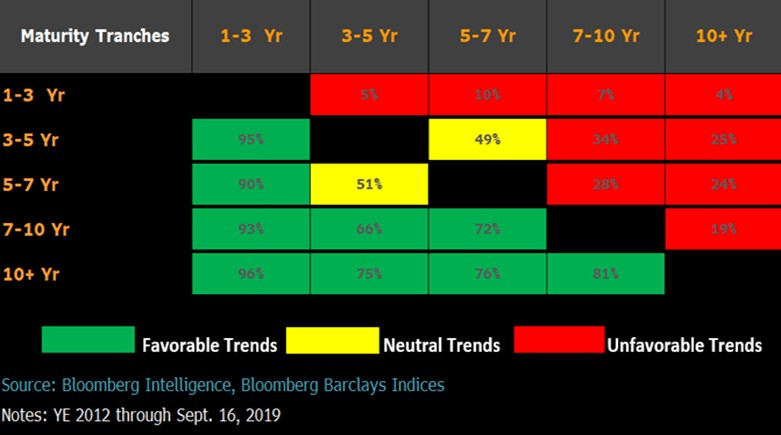
Viewed across maturity buckets, spread ratios show the short-end of the curve as rich vs. other tenors, and a generic discount for any tenor relative to shorter-dated paper. Spreads in the 1-3 year part of the curve are richest vs. other maturities, with option-adjusted spread (OAS) in the top decile vs. that of other tranches (spreads have only been tighter on a relative basis less than 10% of the time dating back to 2012.)
The intermediate part of the curve is neutral, with OAS in the 3-5 year vs. 5-7 year buckets in-line with historical norms, while maturities beyond 10 years are generally in the bottom quartile. Much of this is attributable to the flattening and periodic inversion of the Treasury curve, which actually has longer-dated yields trading near their tightest levels, even as OAS is near the widest.
Spread relationship by maturity bucket
Energy, basic materials see more differentiation
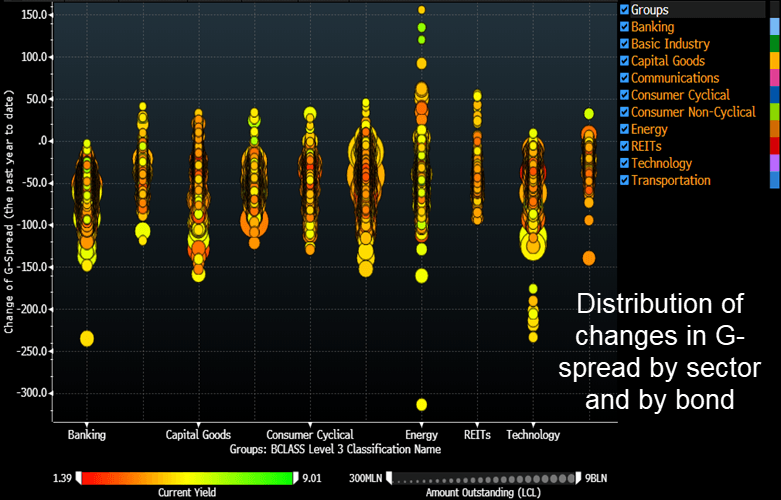
Spread compression across single A and triple B rated corporates has been consistent across most sectors thus far in 2019, with energy the notable exception. Even as spread for the sector has tightened notably, the dispersion has been greater, as issuers such as Buckeye Partners widened on downgrade risk and EQT paper widened as credit raters’ outlooks soured on the low-BBB issuer. Basic materials were similar, if less pronounced, as long-dated low-BBB and crossover paper from Mosaic and Methanex trailed in spread-performance terms amid rising economic uncertainty.
Banking and the technology sector have fared better in relative terms, even as nominal spread compression has been less, given the lower initial spread.
YTD change in G-spread: A & BBB corporates
High yield spread risk rises in unexpected places as BBs lead
Comparative value between double-B corporates and bonds that are rated higher and lower remains rich in relative and absolute terms. Alternatively, even as high yield has advanced better than 11% thus far in 2019, CCCs have trailed, leaving spreads cheap in historical terms and yields for the rating tranche two standard deviations away from the 10-year average.
Leadership of BBs signals reluctant risk taking
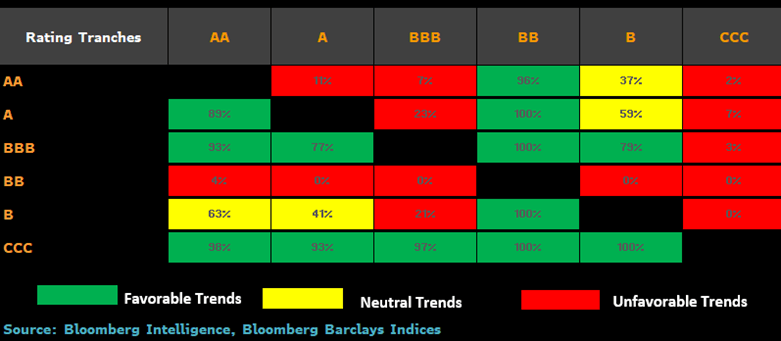
A renewed rally for high yield may be signaling more about what’s wrong than right with risk appetite, as double B corporate bond spreads are trading at their tightest levels vs. other rating tranches in well over a decade. The option-adjusted spread (OAS) relationship between double B and each of triple-B and single-Bs is effectively two standard deviations from the norms of the past two decades.
Relative to triple-Bs, double Bs offer substantially shorter duration (3.5 vs. 7.3 years) and incremental yield (4.1% vs. 3.4%), while still enjoying a much more favorable historic default profile vs. single Bs. New issuance and refinancing has been comparable for both, indicating investors are only cautiously taking on high yield risk.
Spread ratios percentiles since 2012
Double Bs tight to, well, everything
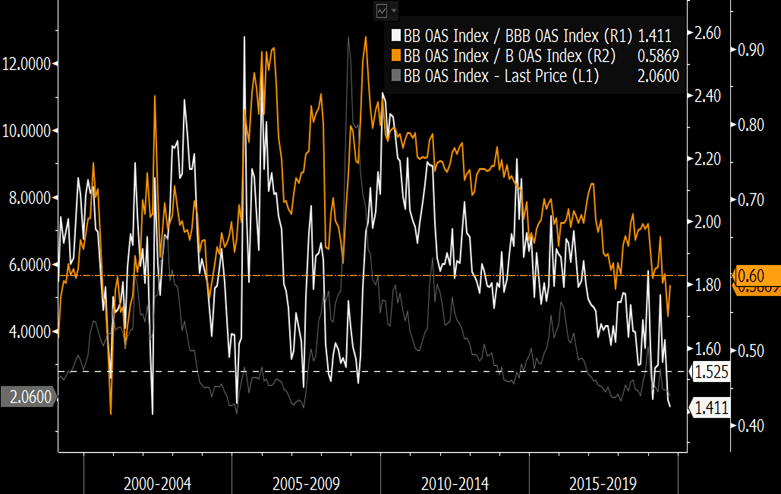
The relationship of double B option-adjusted spreads (OAS) to those of triple and single B rated U.S. dollar corporate bonds has reached levels that are historically extreme and at effectively the tightest level in two decades vs. both of the nearby tranches. In the past, such extreme dislocation has resulted in some recalibration, with that adjustment being led by a broader widening cycle. A far more responsive monetary policy stance globally has changed some of the reaction function for markets, which may mean the dislocation persists for longer. However, we still view some normalization of today’s overpricing of BBs.
Double B corporate spread vs. BBB and B
Inverted returns by rating set new precedent
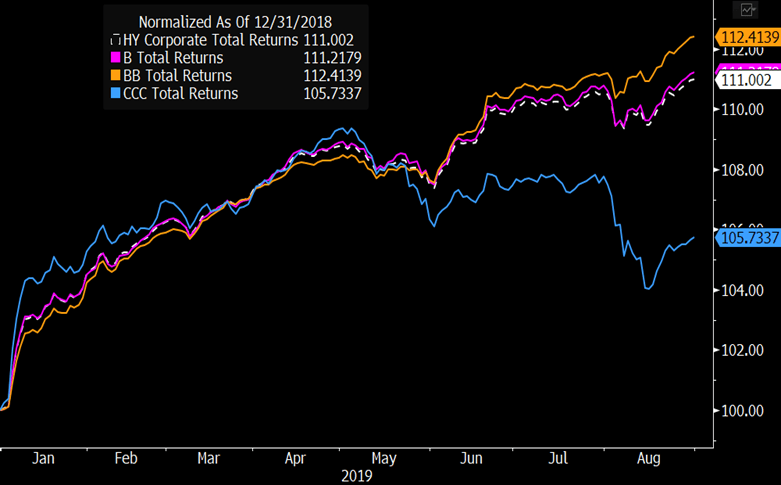
August perpetuated a trend that has persisted for much of 2019: a demand for high yield, but more so for the highest rated tranches. While some of the outperformance for BBs is due to duration (closer to 3.5 years vs. three years for the broader index), a reluctant allocation to the asset class amid inflows and broader chase for yield looks more culpable.
Double-Bs rung-up total returns of 1.17% in August vs. 0.23% for single-Bs and a loss of 1.88% for CCC and lower rated issues. For the year, those numbers are 12.4%, 11% and just 5.7%. While it isn’t unusual for CCCs to lag when the index advances in any given year, it is when the index gains as much as it has in 2019: Since 1997, the ICE BofAML US High Yield Index had delivered a double-digit total return on eight occasions, with CCCs the top performing tranche each time.
Total returns: U.S. high yield by tranche
TMT lags in broader advance for double Bs
Breaking down sector-level spread action for double B rated bonds relative to the nearest ratings buckets, a few clear themes emerge. Communications, among the best-performing sectors, has seen BB spread tightening outpace that for BBBs, though only keeps pace with single B peers. That’s more a testament to single B paper from the sector, as Sprint bonds have rallied on merger expectations, and Altice debt has gained on refinancing moves and operating improvements.
Outside of communications, since April we’ve seen double B rated technology names underperform as spreads on bonds from Pitney Bowes and Xerox have widened, whereas most other sectors have seen BB rated bonds lead both BBBs and Bs in relative spread compression.
Cross-rating sector spread ratios
