Behind stock price movement: Supply & demand in market microstructure and market influence
This blog is the first of four installments outlining our Stock Price Movement Journal of Trading paper published by our quantitative research team.
How can we measure the supply-demand imbalance in the stock market and how much does that affect the movement of the stock prices?
In a recent Journal of Trading paper, we studied short-term stock price movements in the U.S. equity market. The movement of a security price is mainly driven by the imbalance between supply of and demand in the marketplace. We investigated four different factors that might impact the price movement.
- Quote imbalance in the central limit order book.
- Trade imbalance in the lit venues.
- Trade imbalance in the dark venues.
- Overall market movement.

We built a multivariate linear model based on these factors and measured how they affect the price movement using 42 US stocks as a representative sample set. Our major findings are
- These four factors explain the majority (up to 80%) of the price movement for the time interval of 30 seconds to 1 hour.
- The dark trade imbalance generally has less impact on the price movement than the lit trade imbalance does.
- Small spread stocks are quote-driven (the quote imbalance is more significant than the trade imbalances) and the large spread stocks are trade-driven.
This study not only sheds light on fundamental elements that drive stock price movements, but also suggests ways for trading algorithms to optimize order execution performance by controlling their footprints in the marketplace.
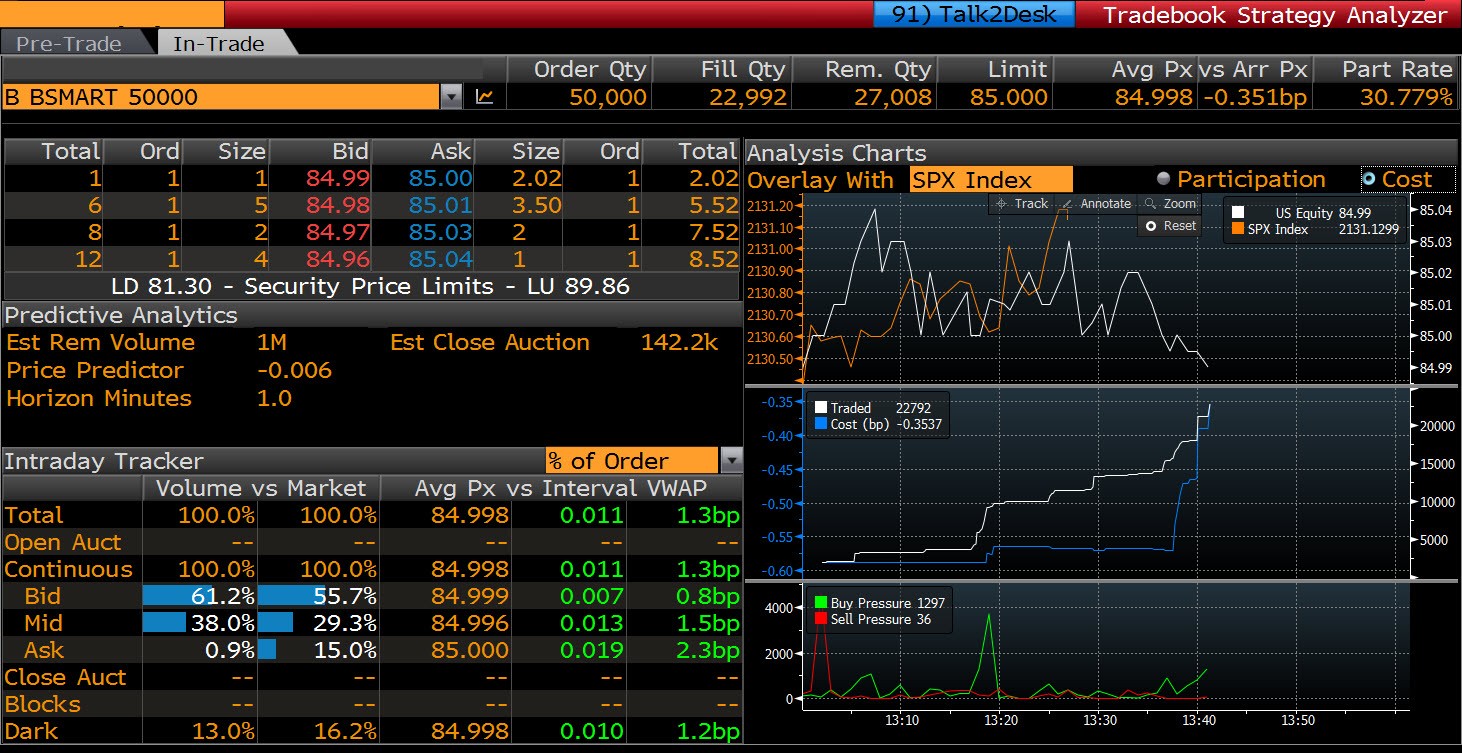
STAZ provides information on these factors, which helps traders understand how their orders are being executed in the market. In particular, STAZ In-Trade shows what percentage of an order is being executed in the lit vs. dark venues, what percentage represents liquidity making vs. taking, how the stock price is moving in line with the overall market.

Strategy Analyzer STAZ<GO> In-Trade
We will provide more detail in subsequent blog posts.
Part 2. Modeling stock price movement
Part 3. Explanatory power of the model
Part 4. Classification of stocks based on the bid-ask spread