After Nasdaq death cross, technicals signal key level
Bloomberg Market Specialist Adriana Gill contributed to this article. The original version appeared first on the Bloomberg Terminal.
Background
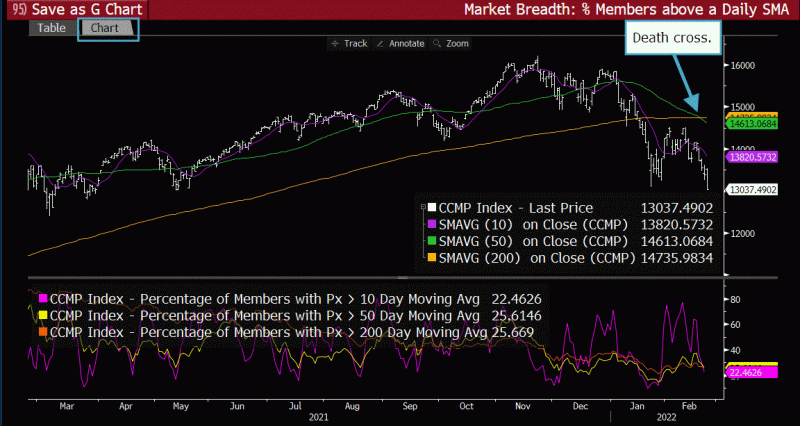
In February, the Nasdaq Composite Index fell into an ominous “death cross” for the first time since April 2020, when the early days of the pandemic threatened the global economy and stoked investor fears over an uncertain U.S. equity markets. The bearish technical pattern, appearing when an index’s short-term 50-day moving average crosses below its longer-term 200-day moving average, is seen by some investors as giving clues about longer-term trends and at times has been indicative of upcoming near-term weakness.
Less than a month later in March, the S&P 500 Index entered its own death cross for the first time since March 2020, following the blue-chip Dow Jones Industrial Average achieving this earlier that month. Similar occurrences in the S&P 500 Index were seen in November 1999, amid the peak of the dot-com era, and in October 2000, when the bubble burst. A death cross appeared again in December 2007 ahead of the global financial crisis.
The issue
From a historical perspective, a death cross has often been seen as a lagging indicator. By the time it appears, the move in equities has already occurred. The Nasdaq entered a death cross in April 2020, for example, but the index actually bottomed out in March of that year.
This hasn’t been the case for the tech-heavy Nasdaq this time. The index dipped lower following the onset of its death cross in February, rebounded from a low in mid-March, then dropped even lower again by the end of April. The Nasdaq death cross was also followed by war in Ukraine, the Federal Reserve’s efforts to curb inflation and a couple of tough months for equities markets. The first week of May has been turbulent, with the Fed announcing its biggest rate hike since 2000 and markets entering a widespread selloff, with tech stocks taking the biggest hit.
A Bloomberg analysis from February anticipated the market’s continued decline and correctly showed that the index hadn’t seen its bottom yet. At the time, the number of stocks in the 3,727-member index declining on a daily basis during 2022 averaged 1,945, about 30% more than the 1,489 that had advanced each day, on average. That indicated a downward momentum could persist, bringing the index to as low as 12,120. With the market closing the first week of May at around that number, it’s yet to be seen if the anticipated low from February’s analysis will approximate the actual low we’ll see given subsequent events such as Russia’s invasion of Ukraine and growing fears of an upcoming recession.
Tracking
Bloomberg functions anticipated further declines in the Nasdaq Composite Index following its February death cross.

For more information on this or other functionality on the Bloomberg Professional Service, click here to request a demo with a Bloomberg sales representative. Existing clients can press <HELP HELP> on their Bloomberg keyboard.