Visualize portfolio performance and risk with Microsoft Power BI
Bloomberg Market Specialists Constantin Cosereanu, Nelson Yu and Malkie Zweig contributed to this article. The original version appeared first on the Bloomberg Terminal.
Background
At the beginning of 2022, investment outlooks predicted a volatile market. Inflation was expected to rise while the stock market slowed. Experts predicted negative bond returns and single-digit stock returns. Trending assets included environmental, social and governance investing, although experts suggested that cryptocurrency had not coalesced into a viable portfolio asset.
The issue
As the market fluctuates, investors need visibility into how their portfolios are performing. Visualizations are crucial for effectively sharing information with your team or clients about what’s happening with your portfolio.
Visualizations can also help you make timely investing decisions — and this feature couldn’t come at a better time. As investors try to gauge the impact of factors including Fed tightening, the impact of the pandemic and geopolitical events such as Russia and Ukraine, markets are becoming more volatile.
Bloomberg’s PORT Enterprise is a multi-asset advanced portfolio analytics and risk management solution which allows you to visualize portfolio performance with its latest integration with Microsoft Power BI. You can seamlessly create portfolio report dashboards in Microsoft Power BI that can be shared with your team or clients.
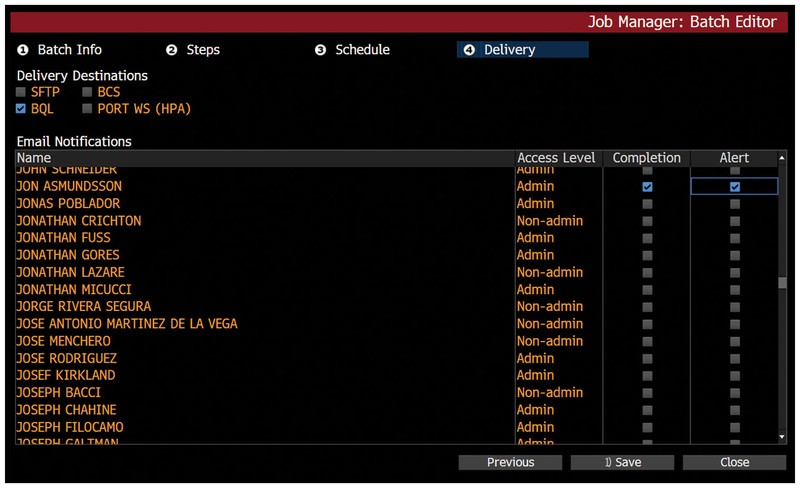
Underpinning this new reporting flexibility is Bloomberg Query Language (BQL) within PORT Enterprise. In effect it enables PORT Enterprise users to generate portfolio reporting datasets, hosted in the Bloomberg cloud, that can then be analyzed in Excel, Microsoft Power BI, Tableau and Bloomberg’s Quant platform (BQuant).
Tracking
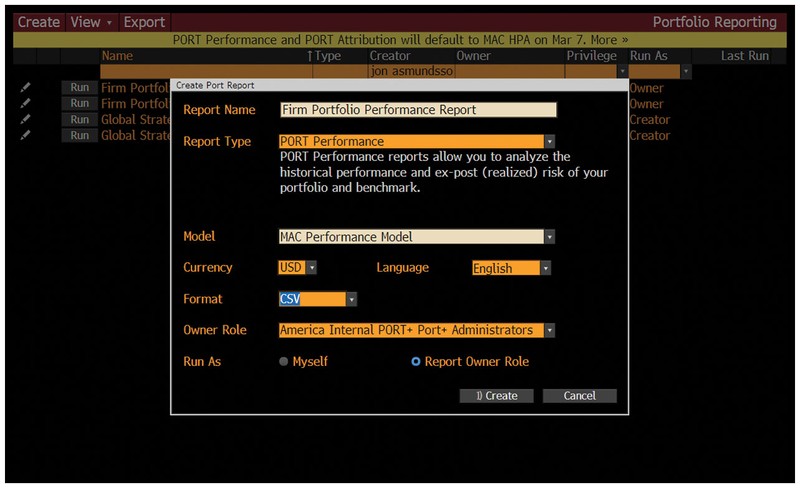
PORT Enterprise users can take the portfolio they have loaded in PORT and create a portfolio report via PREP<GO>. A series of steps, lets you specify the particulars of your report such as a portfolio, benchmark, classification and the period covered by the report.

You can then use the Job Manager screen JMGR<GO> to set up the details of your batch job, which is a set of steps that automates the running of your report.

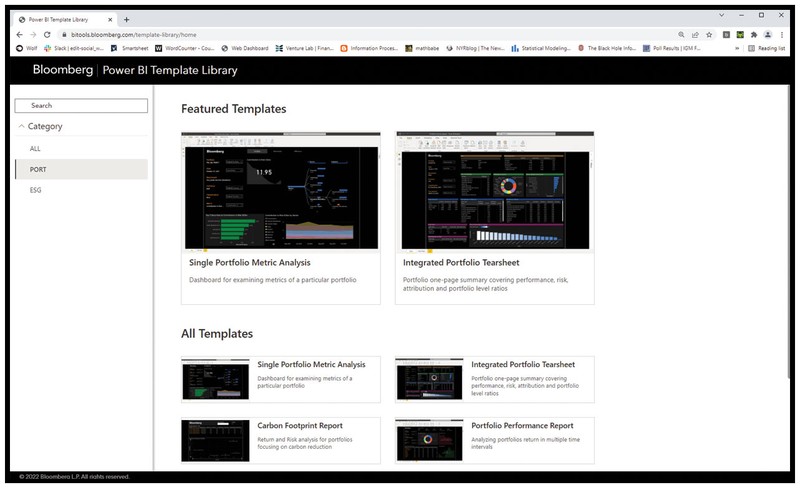
Finally, you run BITL<GO> to load the Bloomberg Power BI template library and select one to open within Power BI application. Once you refresh Power BI and enter Bloomberg login credentials, you will see the PORT data imported into Power BI.

For more information on this or other functionality on the Bloomberg Professional Service, click here to request a demo with a Bloomberg sales representative. Existing clients can press <HELP HELP> on their Bloomberg keyboard.