This analysis is by Bloomberg Intelligence ESG Analyst Shaheen Contractor. It appeared first on the Bloomberg Terminal.
Comparing the characteristics of ESG ETFs will become a tough but necessary part of fund analysis as new funds are launched, companies enter the market and strategies increasingly diverge. For example, a comparison of carbon intensity across funds is skewed without the use of estimates, we find. Our BI ESG ETF Exposure Scorecard helps measure and compare fund characteristics using some of the more widely available metrics.
Divergences increase as offerings get crowded
ESG and values-based assets have been steadily rising and fund offerings are seeing a widening roster of new players and strategies. While this will continue to support a growing market, it adds to the analytical challenges. We believe that understanding strategy differentiations between funds is going to become a necessary part of analysis and selection. As competition increases, uniqueness will become key and strategy divergences will continue to increase.
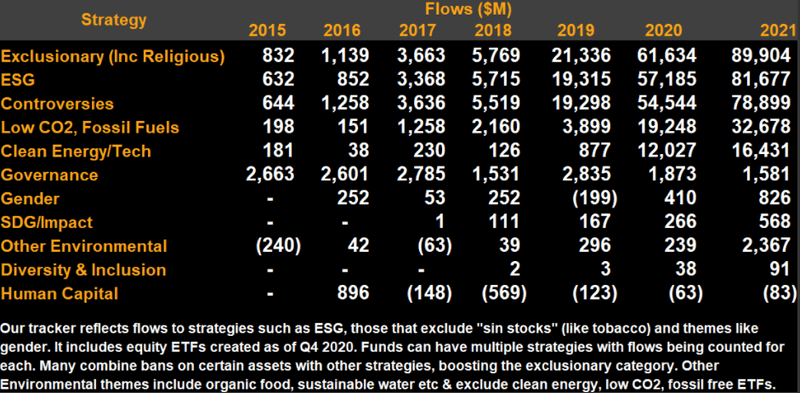
Our flow tracker provides the breadth of strategies pursued in sustainable and values-based investing, which ranges from ethical exclusions to ESG integration to niche strategies like gender. Our ESG ETF Scorecard compares funds that include ESG criteria, with even those seeing wide divergences on the level of inclusion.
ESG and values based flow tracker

Challenges to ESG exposure comparisons
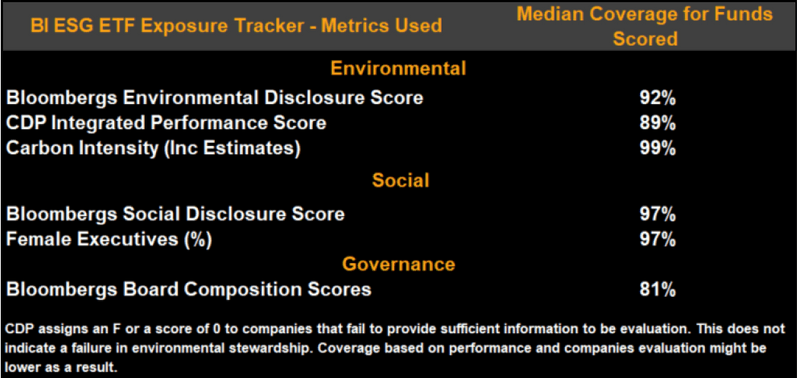
As ESG funds see a diverse array of strategies, comparing exposures remains a challenge. Our scorecard ranks funds based on ESG metrics covering both disclosure and performance. While the metrics chosen don’t serve to provide a full view of what can be included, they represent some of the more comparable and widely available criteria for fund analysis. Given the many ESG definitions, several other fields can be considered. However, data quantity remains a challenge and low coverage can lead to a skewed ranking, similar to our carbon-intensity analysis. As a result, we choose metrics with a median coverage of 70-80% for funds across regions. For EM funds it often falls below 50%. Because ESG data is for equities, funds that have a large allocation to asset classes like sovereign debt, cash and futures are biased downward.
BI ESG ETF exposure ranking

Carbon estimates needed for holistic fund analysis
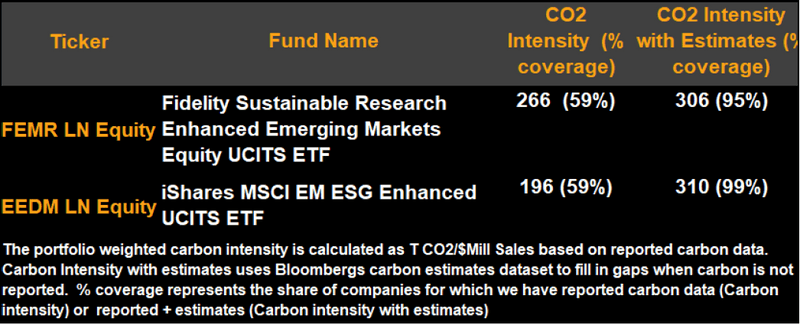
As climate continues to be a focus, understanding the carbon intensity of funds is critical and we believe that integrating estimates is a necessary step to ensure comparability. This is due to gaps in CO2 reporting, leading to low coverage, particularly in small caps or emerging markets. As sectors such as utilities have much higher emissions than others, missing disclosures for even a few companies can result in skewed carbon intensity. The iShares MSCI EM ESG Enhanced UCITS ETF, for example, has a CO2 intensity lower than the Fidelity Sustainable Research Enhanced Emerging Markets Equity UCITS ETF. However, after filling in the gaps with Bloomberg’s carbon estimates, its intensity is higher than the Fidelity Fund.
Bloomberg’s Historical Carbon Estimates provide coverage for over 50,000 companies globally.
Carbon intensity analysis of funds
