
Bloomberg Intelligence
This article was written by Bloomberg Intelligence Equity Strategist Kaidi Meng. It appeared first on the Bloomberg Terminal.
Europe’s IPO comeback hindered by flatter ECB, BOE easing path
This year is shaping up to be one of the weakest for European IPOs since the financial crisis, with our analysis showing the likelihood of more EU and UK companies listing in the US instead to pursue higher multiples and stronger post-IPO prospects. That’s based on anticipated flatter ECB and BOE rate-cut paths and historical data.
Flatter ECB rate-cut path may accelerate European IPO migration
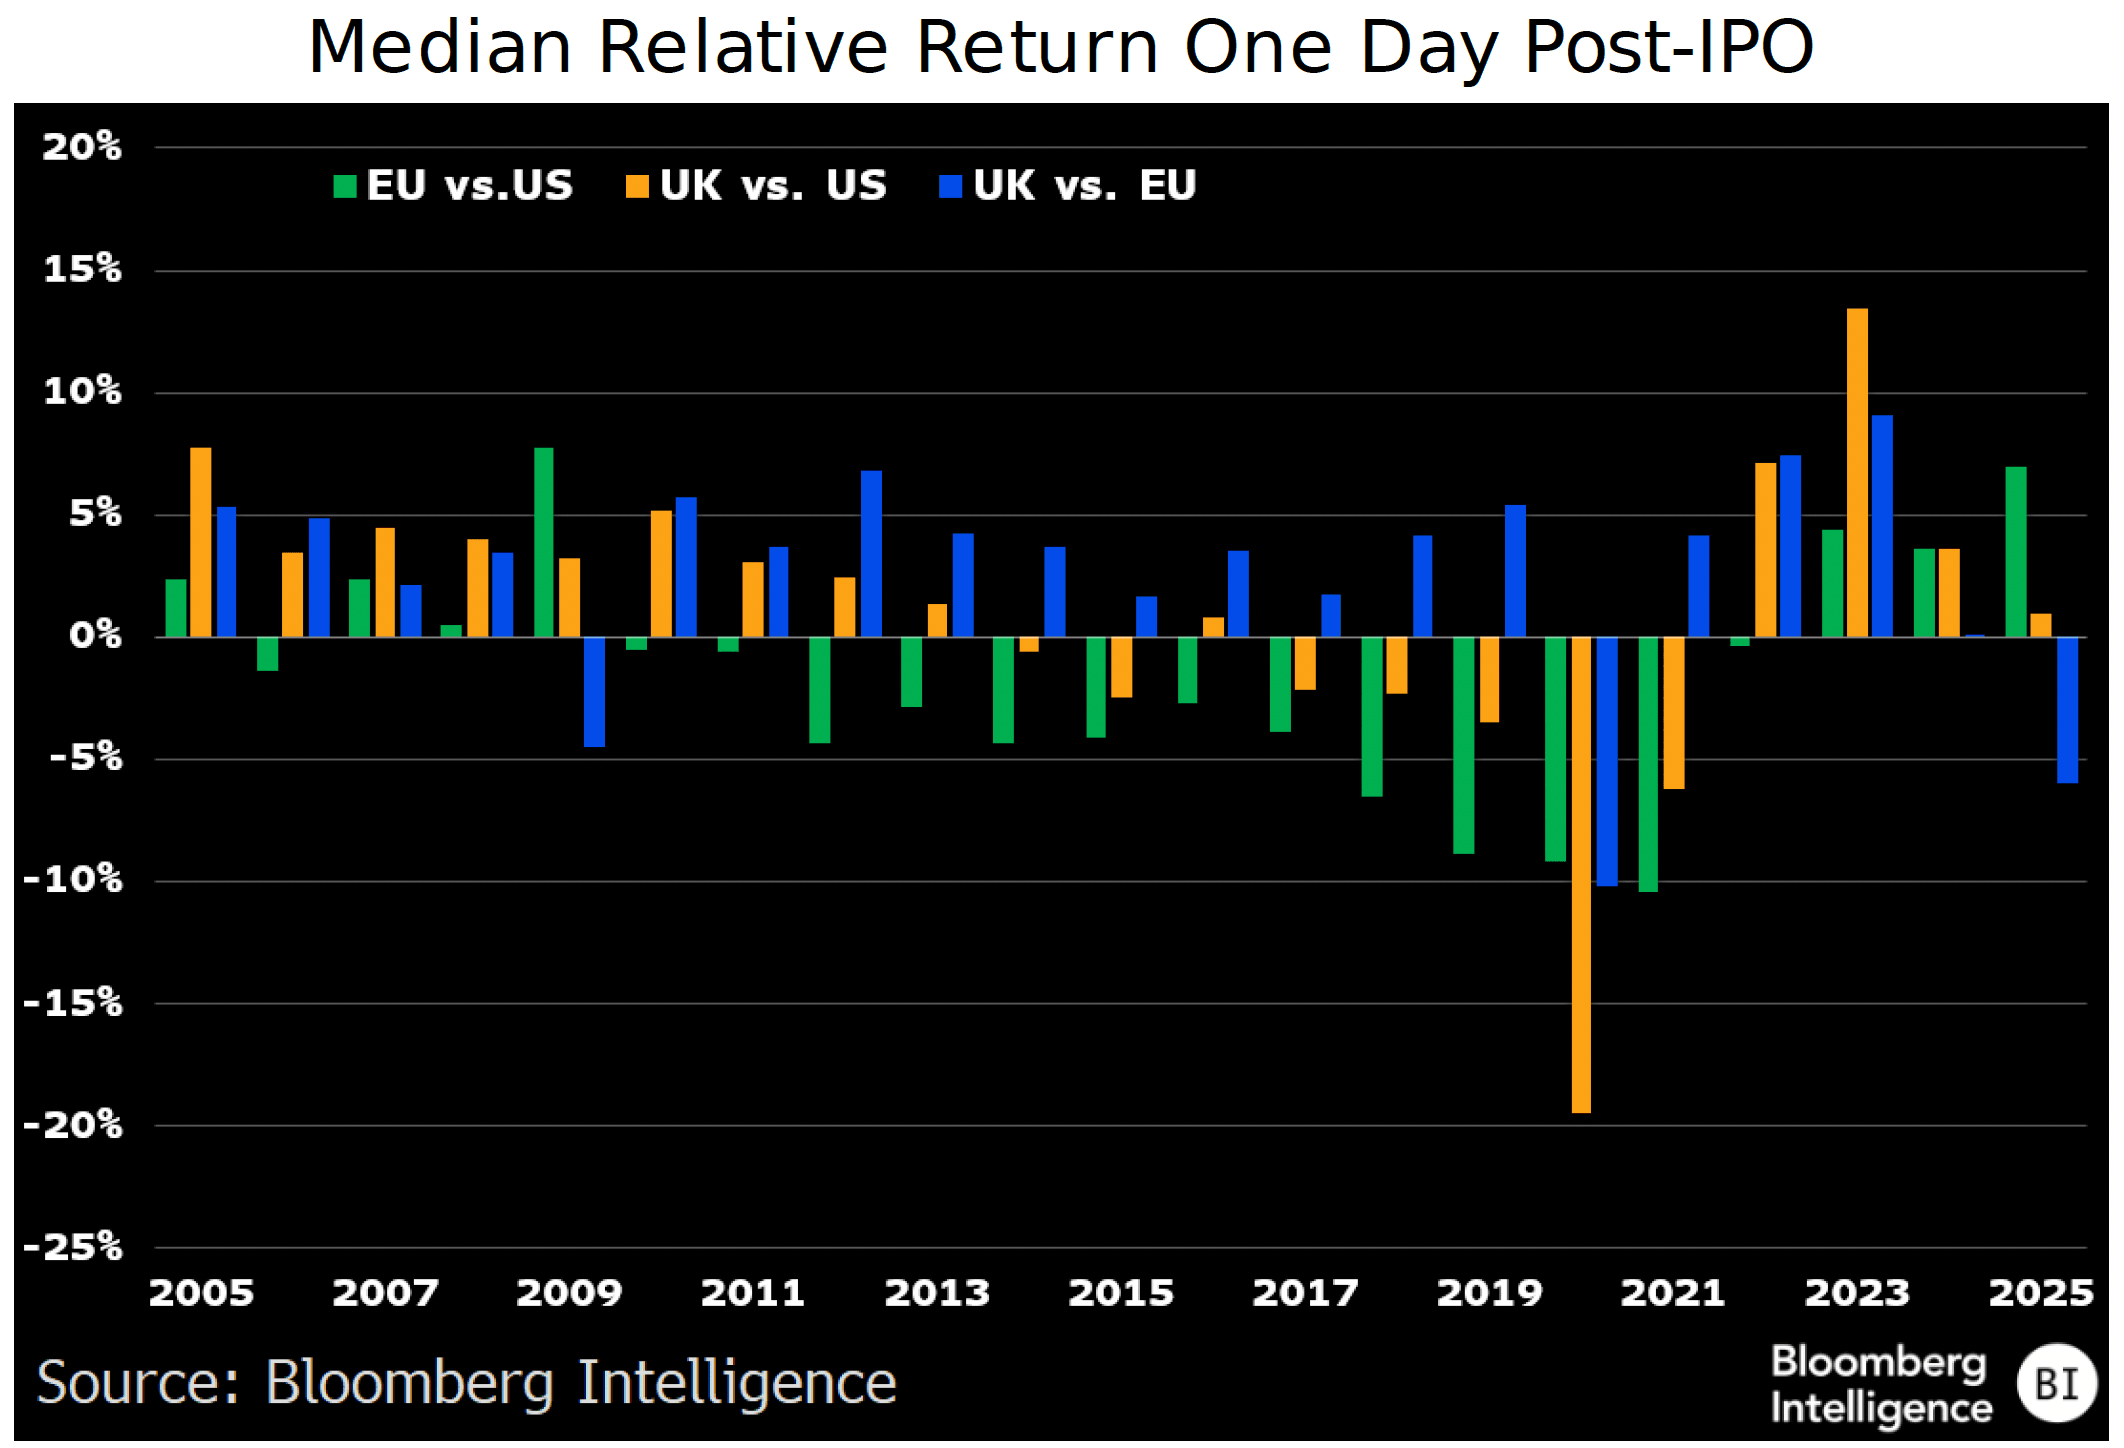
A faster rate-cut cycle by the US Federal Reserve vs. that of Europe’s central banks looks set to weigh on the relative post-IPO returns of European vs. US equities. From 2014-21, both traditional (non-SPAC) EU and UK IPOs broadly underperformed US listings on the first day of trading, with 2020 marking the weakest year (9% vs. 19%, respectively, on a median basis). This pattern briefly reversed after the Fed’s 10 straight hikes totaling 525 bps which drained stock-market liquidity and squeezed the valuations of growth-oriented IPOs in the US.
The flatter rate-cut trajectory now unfolding in Europe may again limit post-IPO relative performance and drive domestic companies to list overseas, particularly in the US, where a faster liquidity rebound and deeper capital markets offer a more favorable pricing backdrop.
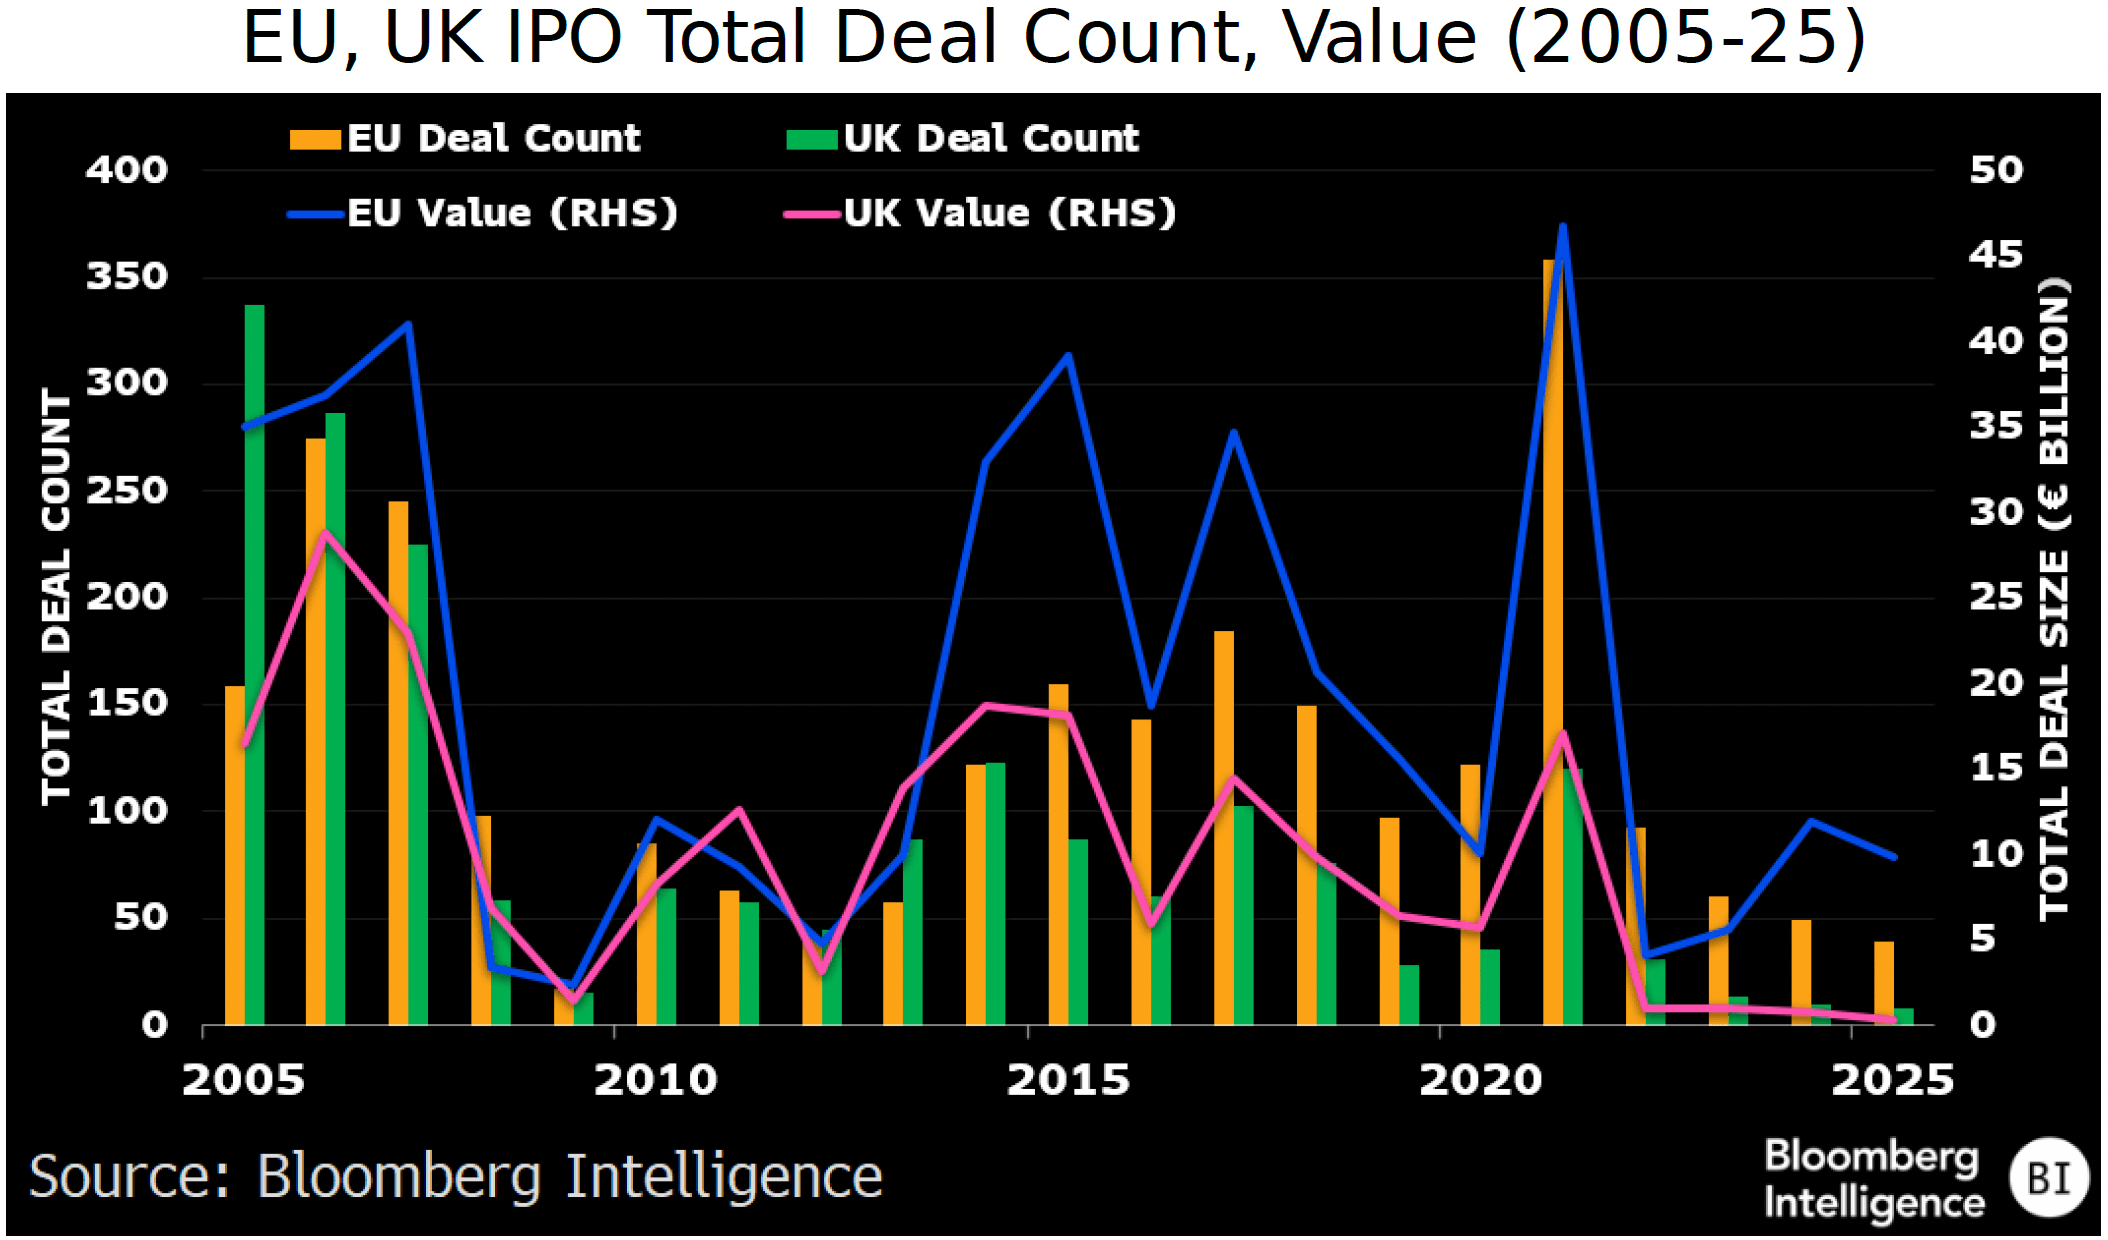
EU, UK 2025 IPOs near 20-year low
European IPO activity in 2025 is at its lowest point since the 2009 financial crisis, marking the second-weakest year in 20. Just 47 deals were completed in the first nine months, marginally above last year’s 44, but 70% below the 20-year average of 160. Since 2005, the UK was home to just 43 IPOs in the $1-$10 billion range vs. 120 in Europe and 175 in the US.
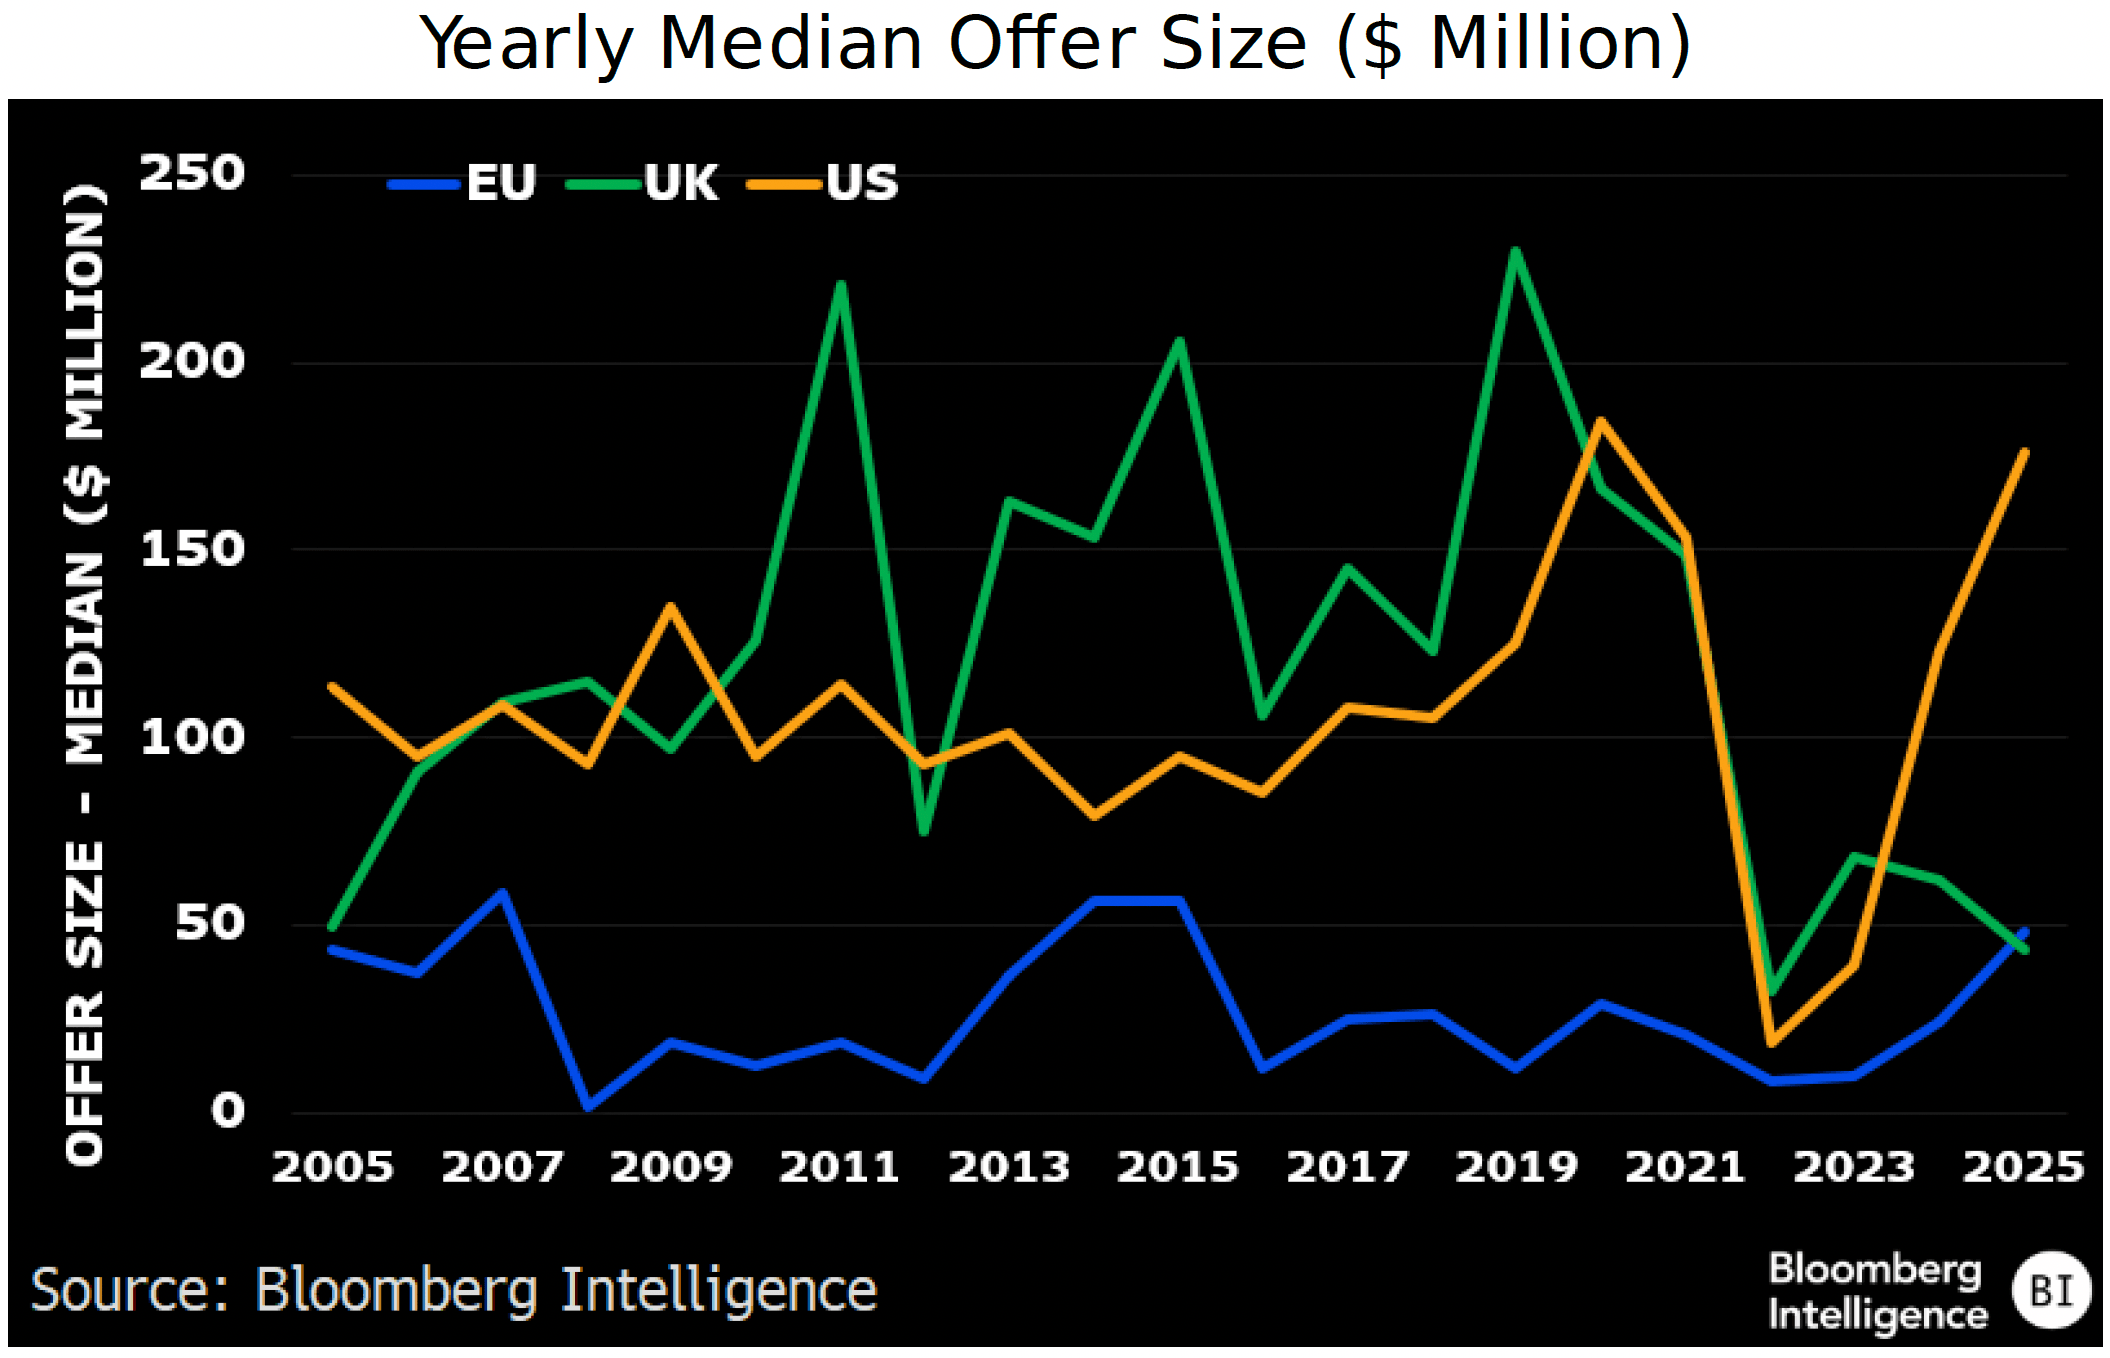
UK deal sizes also sharply contracted, with the median at $44 million in 2025 vs. the $134 million pre-pandemic average (2005-19). In contrast, EU and US IPOs have increased in size, rising to$48 million and $176 million, respectively, on a median basis, well above their pre-pandemic respective averages of $28 million and $103 million (see chart for deal-size time series).
Liquidity stagnates for European equities, rises elsewhere
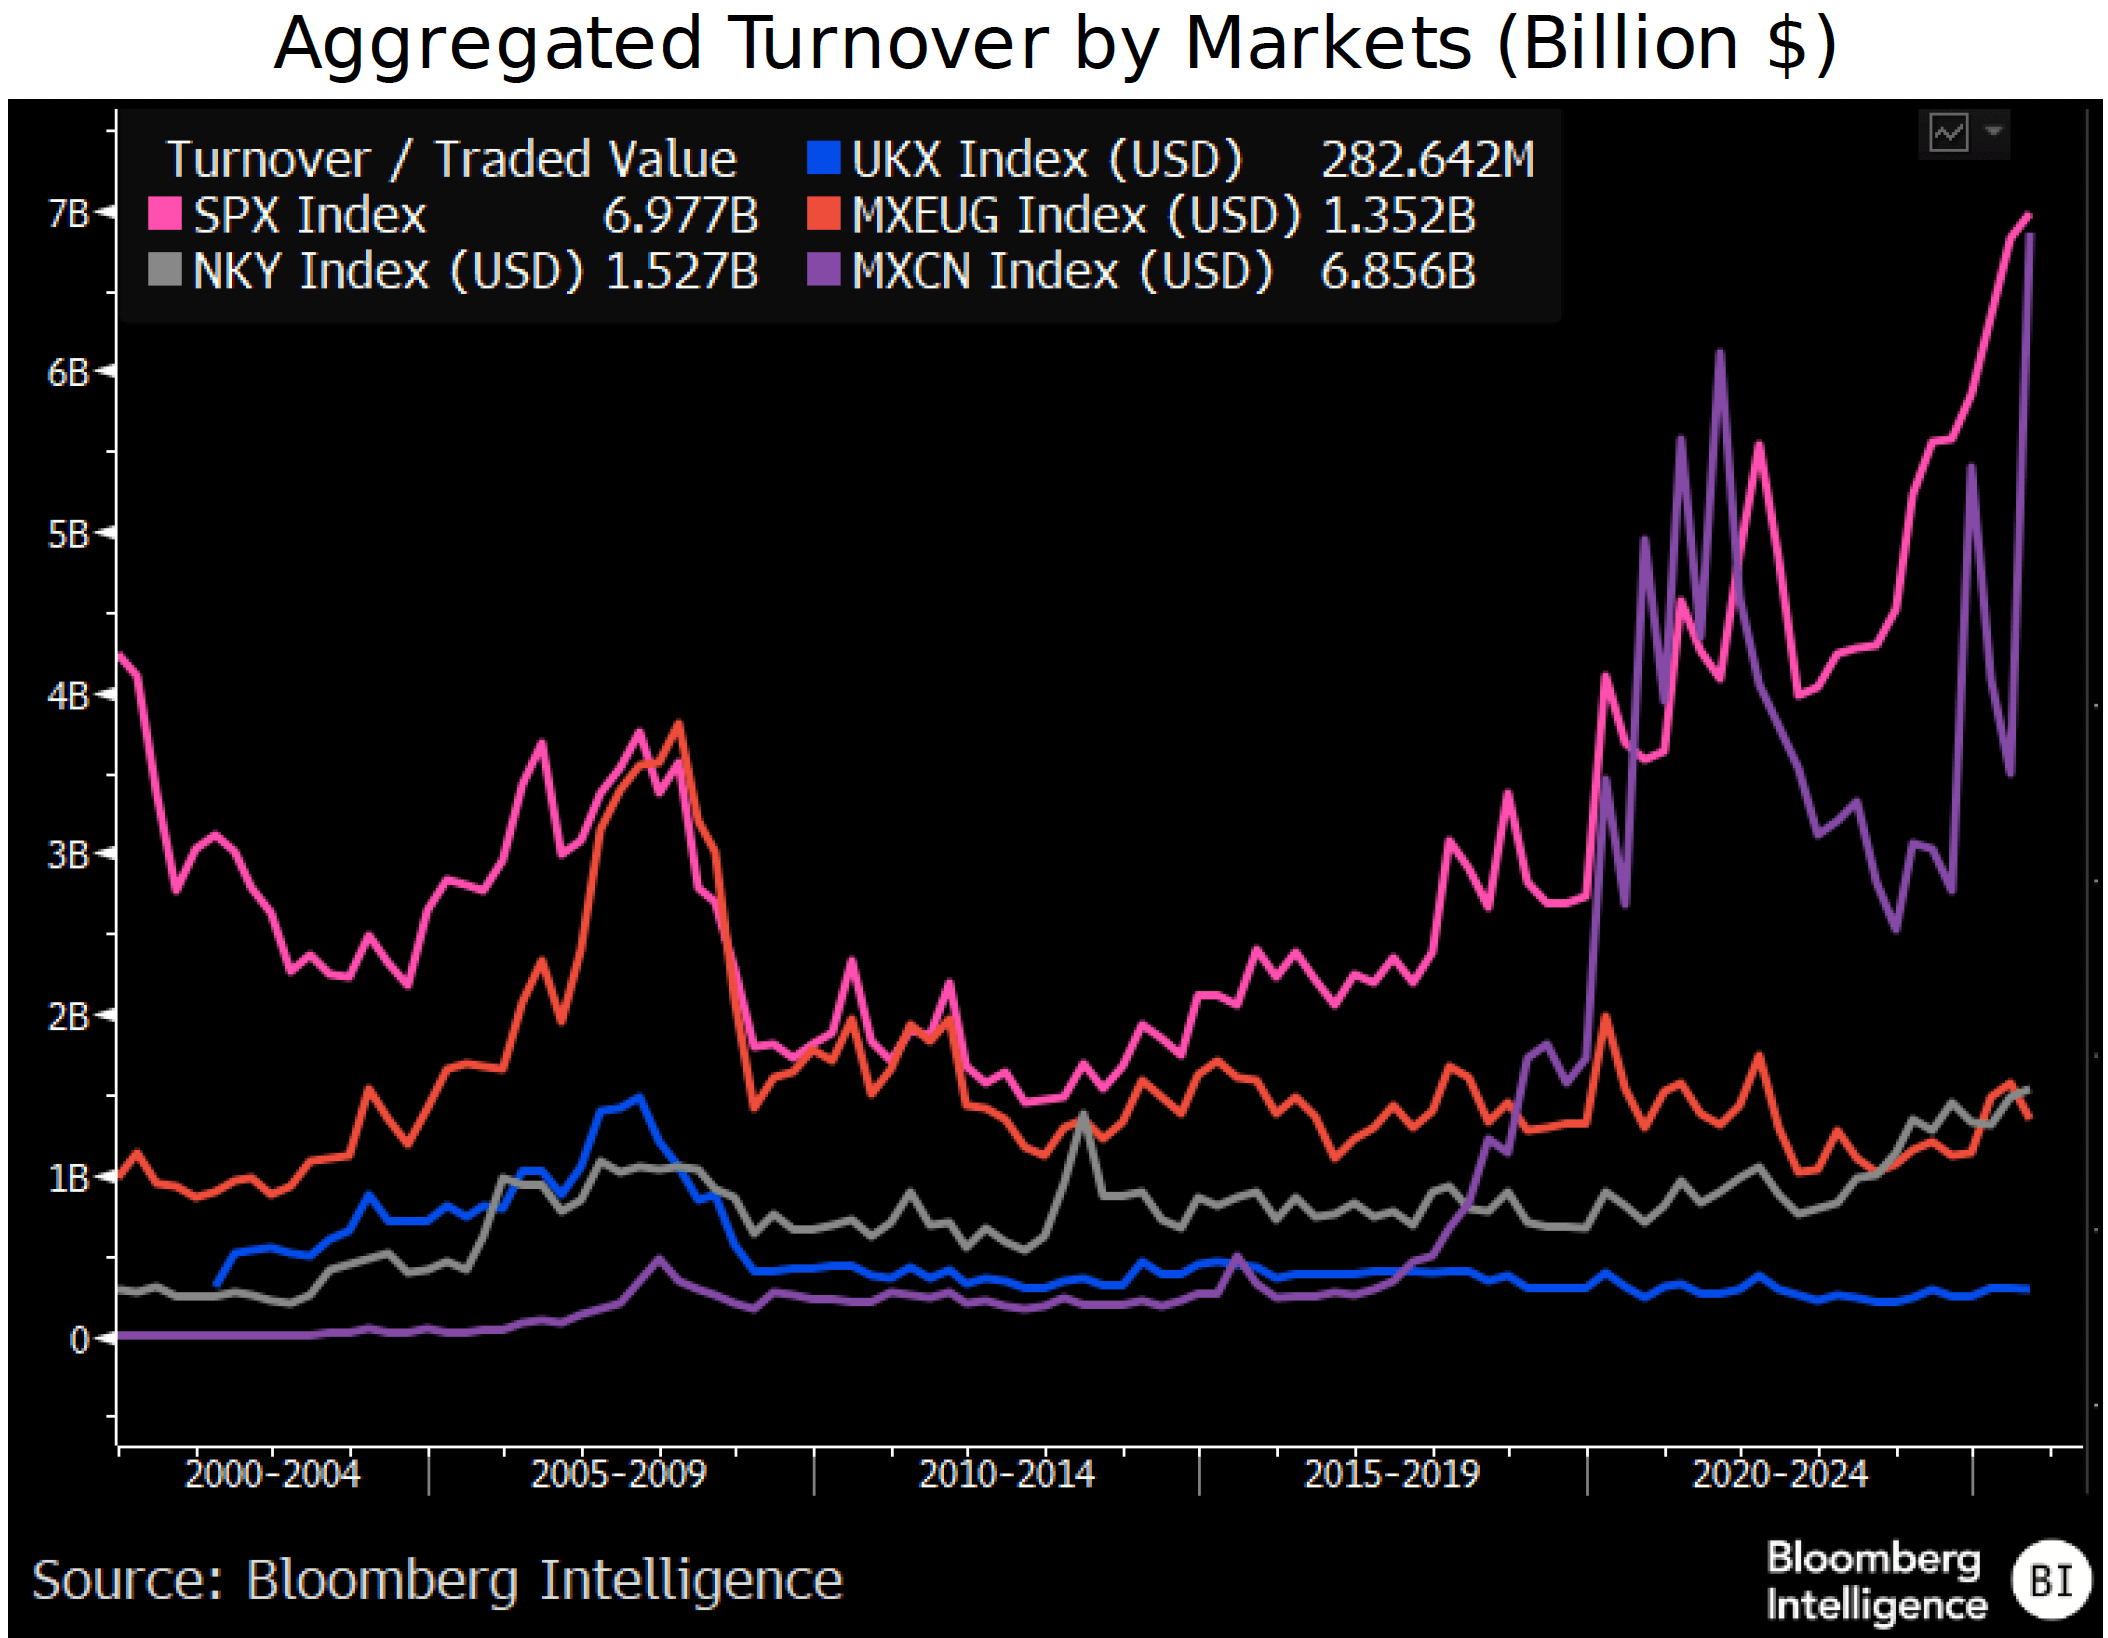
European equity markets’ liquidity constraints may increasingly hinder a revival in the region’s IPOs. The aggregate traded value of the MSCI Europe ex-UK Index (MXEUG) has stagnated since 2009, with the current $1.3 billion pace barely half that of the $3.8 billion early 2008 peak. It’s also well below the S&P 500’s $7 billion turnover and the MSCI China Index’s $6.9 billion. Liquidity in FTSE 100 stocks remains subdued at under $300 million, limiting institutional appetite for new listings and raising execution risk for issuers. Amid rising regulation and costs headwinds, theLondon Stock Exchange (LSE) slipped out of the top-20 ranking of the world’s busiest IPO destinations in September.
Of note, Japan’s Nikkei 225 ($1.5 billion turnover) has been trending up since 2022 and outpaced EU liquidity since 2023.
EU, UK large caps trade at discount to US, even adjusted
The valuation gap remains wide between EU and UK large-cap stocks and their US peers, even after adjusting for sector composition and earnings-growth prospects, making US listings look more attractive. The P/E gap can be partially explained by the heavier exposures of the MXEUG and UKX indexes to value-oriented sectors (financials, energy, materials) and the S&P 500’s concentration in higher-multiple growth and technology names. Yet even after applying US-sector weightings, their adjusted P/E ratios (18.3x and 18.2x, respectively) remain 21% below the S&P 500’s 23.1x.
Both the EU and UK indices have lower PEG ratios (measured by the P/E multiple relative to 2024-27 compounded annual EPS growth) than the US benchmark, suggesting European valuations remain suppressed even when accounting for slower profit expansion.

IPO size shrinks in UK, rises in EU and US
Europe has fewer liquidity options
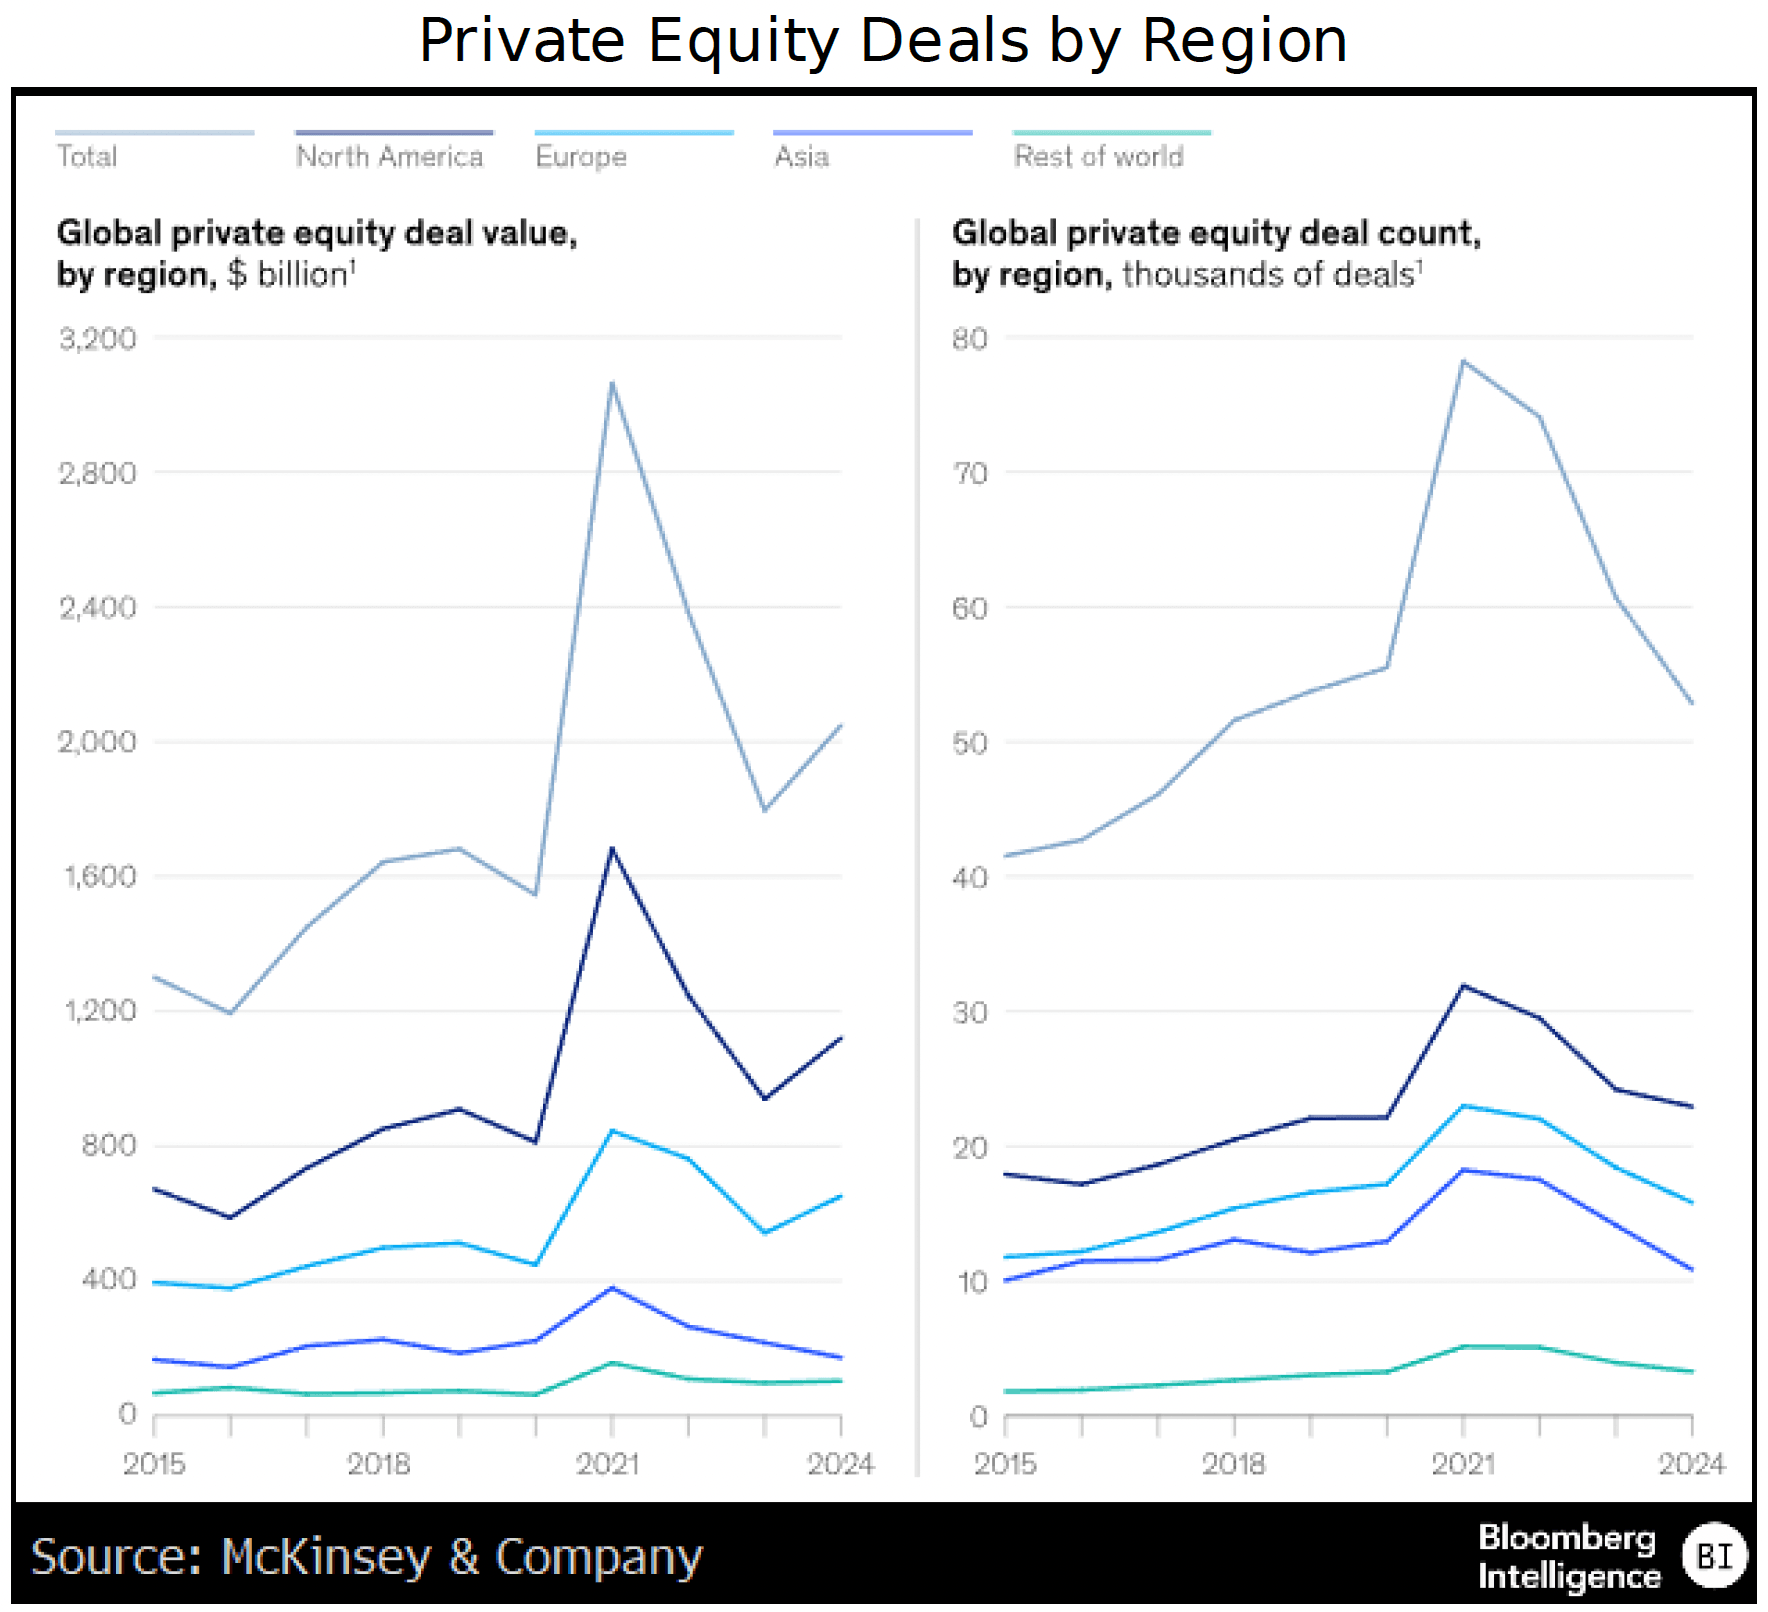
EU companies have fewer private capital options than in the US. It’s not a cash issue — S&P 350 firms in the bloc have a median $2.4 billion in cash vs. $1.5 billion for US S&P 500 members. But EU private equity assets under management total just $1.5 trillion, according to McKinsey, about a third of the US level. US private capital fundraising was 2.2x higher than Europe’s in 2024, per Aranca, and PE firms tend to favor deals in their home markets.
As private markets expand in Europe, public listings could slow, but for now, EU firms are more likely to go public than similar US companies.
The data included in these materials are for illustrative purposes only. The BLOOMBERG TERMINAL service and Bloomberg data products (the “Services”) are owned and distributed by Bloomberg Finance L.P. (“BFLP”) except (i) in Argentina, Australia and certain jurisdictions in the Pacific Islands, Bermuda, China, India, Japan, Korea and New Zealand, where Bloomberg L.P. and its subsidiaries (“BLP”) distribute these products, and (ii) in Singapore and the jurisdictions serviced by Bloomberg’s Singapore office, where a subsidiary of BFLP distributes these products. BLP provides BFLP and its subsidiaries with global marketing and operational support and service. Certain features, functions, products and services are available only to sophisticated investors and only where permitted. BFLP, BLP and their affiliates do not guarantee the accuracy of prices or other information in the Services. Nothing in the Services shall constitute or be construed as an offering of financial instruments by BFLP, BLP or their affiliates, or as investment advice or recommendations by BFLP, BLP or their affiliates of an investment strategy or whether or not to “buy”, “sell” or “hold” an investment. Information available via the Services should not be considered as information sufficient upon which to base an investment decision. The following are trademarks and service marks of BFLP, a Delaware limited partnership, or its subsidiaries: BLOOMBERG, BLOOMBERG ANYWHERE, BLOOMBERG MARKETS, BLOOMBERG NEWS, BLOOMBERG PROFESSIONAL, BLOOMBERG TERMINAL and BLOOMBERG.COM. Absence of any trademark or service mark from this list does not waive Bloomberg’s intellectual property rights in that name, mark or logo.
All rights reserved. © 2025 Bloomberg.