Bloomberg Professional Services
This article was written by Steve Hou, PhD, Quantitative Researcher at Bloomberg.
We live in a golden age of innovation and scientific discovery. The unveiling of ChatGPT in November 2022 and the subsequent wave of AI applications were a Sputnik moment that instantaneously caught the attention and the imagination of everyone on the planet. Just about every day there’s news about yet another ancillary benefit from the weight-loss wonders drug GLP-1, developed by Eli Lilly and Novo Nordisk among others. These advancements are just the tip of the iceberg; from autonomous vehicles to humanoid robots to CRISPR gene editing and AI-driven drug discovery, groundbreaking technologies are emerging at an astonishing pace, reshaping our understanding of what’s possible.
When individual investors are asked about investment vehicles for “innovation”, the Invesco QQQ ETF and the ARKK Innovation ETF are both popular answers. QQQ is a passive ETF based on the Nasdaq-100 index or roughly the largest 100 companies listed on the Nasdaq exchange. Despite a history of being the home to technology companies, the Nasdaq exchange has no explicit screen for innovation in its listing criteria and there are innovative companies, such as the pharmaceutical giant Eli Lilly, that are not listed on the exchange. ARKK is an actively managed ETF portfolio, which does not disclose its methodology for picking innovative stocks. Is there a way for investors to systematically identify innovation? Indeed, there is and that is the focus of this article.
Figure 1: Comparing innovation investing
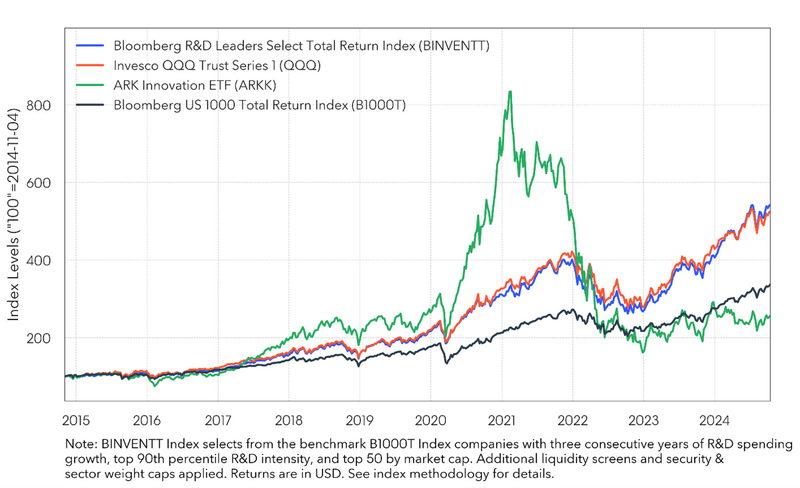
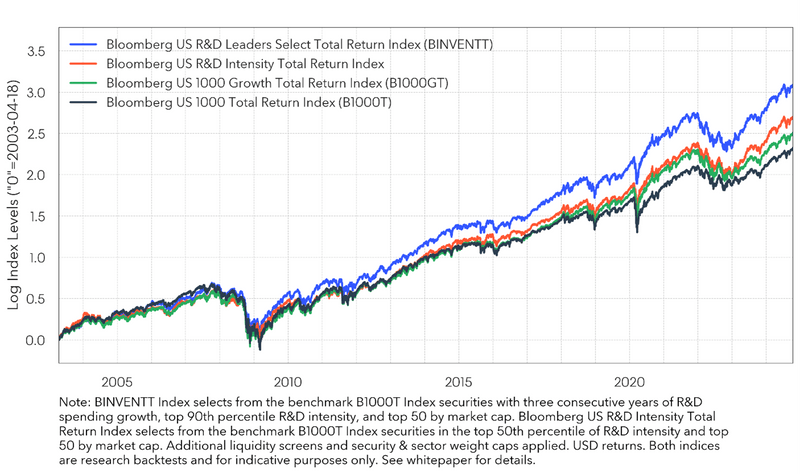
In this article, we argue that innovation can indeed be systematically captured by appropriately measuring corporate Research and Development (R&D) expenditures. We find that the persistence of R&D spending matters even more than how a company spends on R&D (or the intensity of R&D spending). The Bloomberg R&D Leaders Select Index (BINVENT), which tracks the Nasdaq-100 index extremely closely historically and in fact slightly outperforms it in the last couple years, consists of companies with three consecutive years of R&D spending growth with top 90th percentile R&D spending intensity, or R&D spending divided by net sales. [See details of the index construction here.]
Figure 2: Persistence beats intensity
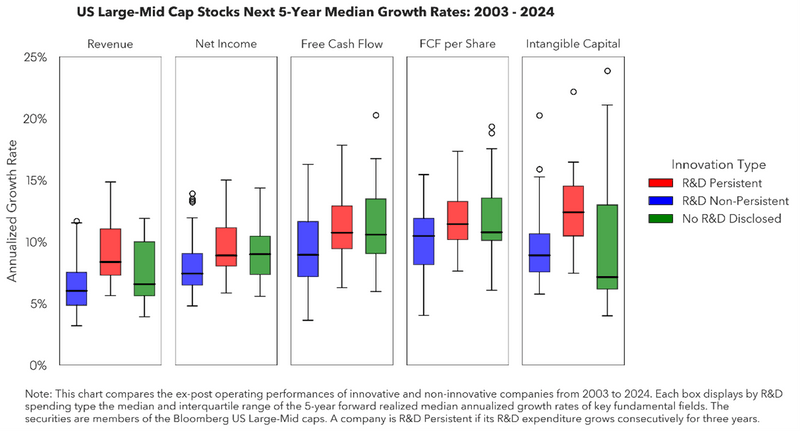
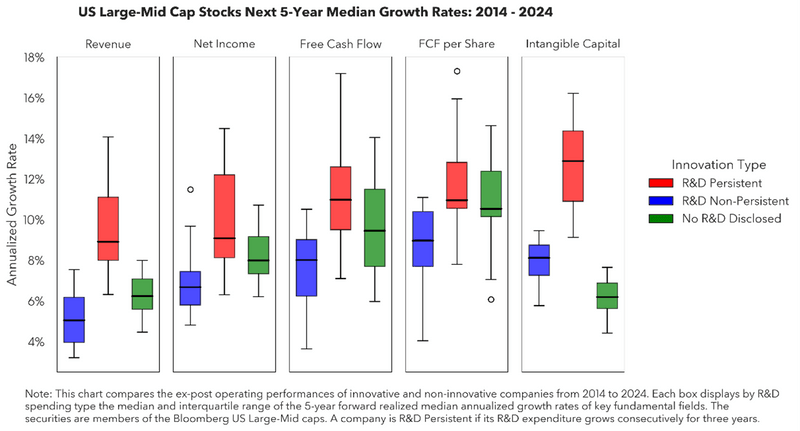
A natural question arises: how do we know these so called “innovative companies” are genuinely innovative rather than simply hype? Innovation is candidly a relatively vague concept that is very difficult to pin down much less evaluate precisely. However, we do know that successful innovation tends to manifest in intangible capital, like the invention of a new product, drug formula or even a new automated manufacturing process that eventually delivers tangible benefits to its corporate owners in the forms of higher revenues, profits or cash flows and more recorded intangible capital like patents.
To reveal the tangible impact of innovation, we can pre-identify innovative and non-innovative companies and compare their realized operating performances. Let’s sort the US Large and Mid-Cap companies into 3 groups: 1) companies that grow R&D spending over 3 prior years consecutively; 2) companies that report R&D spending, but do not grow R&D consistently over the prior 3 years; and 3) companies that do not disclose any R&D spending. We then proceed to calculate the growth rates of each company’s key fundamentals annualized over the next five years. Figure 6 displays the medians and interquartile ranges of the median company’s annualized growth rates across the five fields.
Figure 3: R&D persistence leads to better operating performances
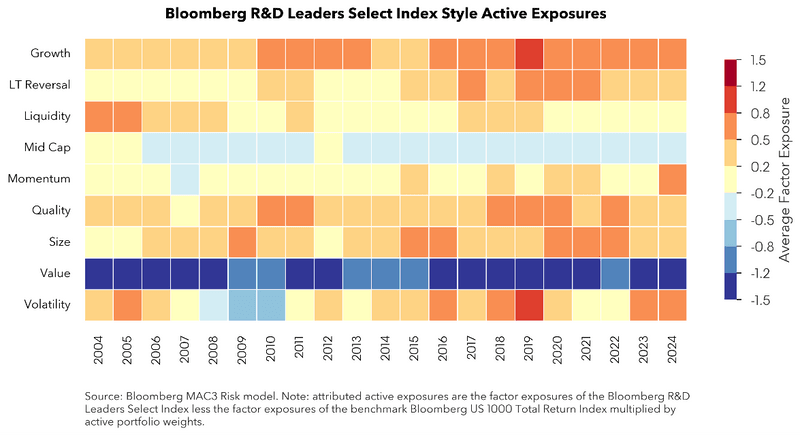
Unsurprisingly, from an equity factor perspective, innovative companies in the BINVENT Index have particularly large and positive active exposures to the growth, quality, and size (large bias) and volatility factors, relative to the benchmark B1000 Index. Interestingly, they have also picked up a strong active exposure to the long-term reversal while exposure to momentum has been very muted until 2024.
Figure 4: Innovation loads on quality and growth
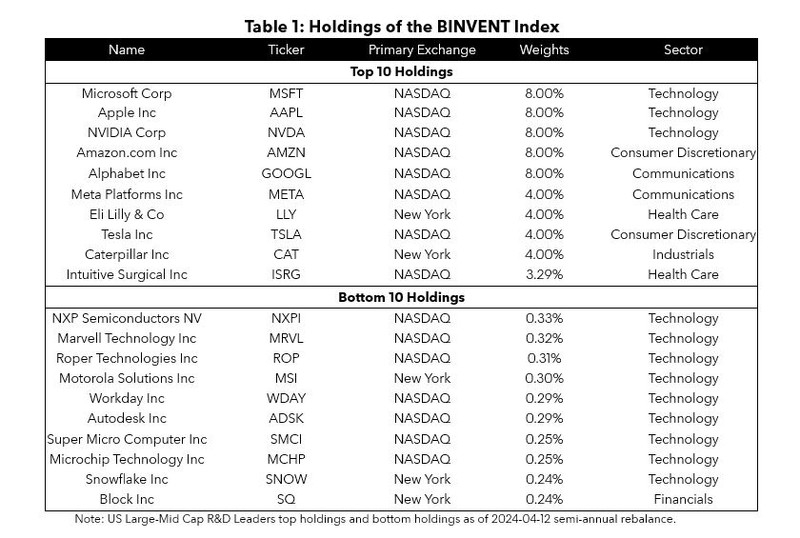
The sample holdings of the BINVENT index reveals another advantage of a systematic rather than exchange membership-based innovation index. While NASDAQ-listed companies dominate the top holdings, several crucial innovators maintain NYSE listings. Consider Eli Lilly, whose GLP-1 breakthroughs are reshaping healthcare, or Caterpillar, whose autonomous vehicle technology is transforming industrial equipment.
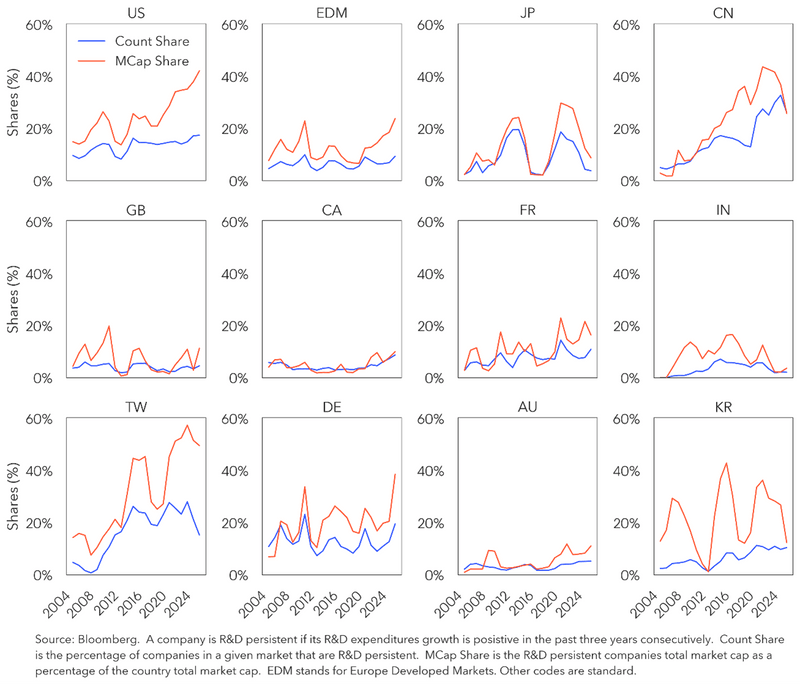
This is reassuring but also brings about its own puzzle. In the 1997 book “The Innovator’s Dilemma”, Clayton Christensen argues that large companies historically struggled to innovate because of the strong incentive to focus on existing profitable customers and improve products for them. Such focus tends to bind or blind them from disruptive technologies that do not meet the needs of their primary market or existing customers. As such, internal bureaucracies and corporate politics tend to prevent sufficient resources being committed to the funding of new projects such as in the form of R&D. Over the last 20 years US Large-Mid Cap companies seem to have overcome the Innovator’s Dilemma. Did US tech founders all read Christensen’s book and discover ways to overcome the dilemma?
Figure 5: R&D persistent companies across global markets
For further details on contents of this article, see the whitepaper, in which we make the case that innovation has been a globally pervasive equity factor across market segments. In the whitepaper, we will successively show that 1) innovation is not exclusively a large cap phenomenon but has been rewarded across market segments; 2) innovation investing in Europe Developed Markets has also been richly rewarded, the reasons for which European equities may have lagged the US, and why there is reason to believe that European innovation may indeed be making a comeback!
- First Trust has launched the First Trust Bloomberg R&D Leaders ETF based on the Bloomberg R&D Leaders Select Total Return Index (BINVENTT Index) under the ticker RND.
- This article provides a summary of key concepts from our latest whitepaper, “The Innovation Factor”.
