Bloomberg publishes PyStack, a debugging tool for when a running Python process crashes or gets stuck
April 19, 2023
Bloomberg’s Python Infrastructure team supports the more than 3,000 Bloomberg engineers who write Python code. The team provides critical infrastructure to ensure that every one of our developers has an optimal programming experience. This team also delivers cross-platform Python runtimes, feature parity for the company’s proprietary toolkits, libraries, and frameworks, as well as classes to train our team to leverage open source libraries like pandas and other infrastructure tools.
One of the tools the team developed is PyStack. Newly released as open source in the lead-up to PyCon US 2023, PyStack uses forbidden magic to let developers inspect the stack frames of a running Python process or a Python core dump. It is meant to help them quickly and easily learn what the application is doing (or what it was doing when it crashed) without having to interpret nasty CPython internals.


PyStack has the following amazing features:
- 💻 Works with both running processes and core dump files.
- 🧵 Shows if each thread currently holds the Python GIL, is waiting to acquire it, or is currently dropping it.
- 🗑️ Shows if a thread is running a garbage collection cycle.
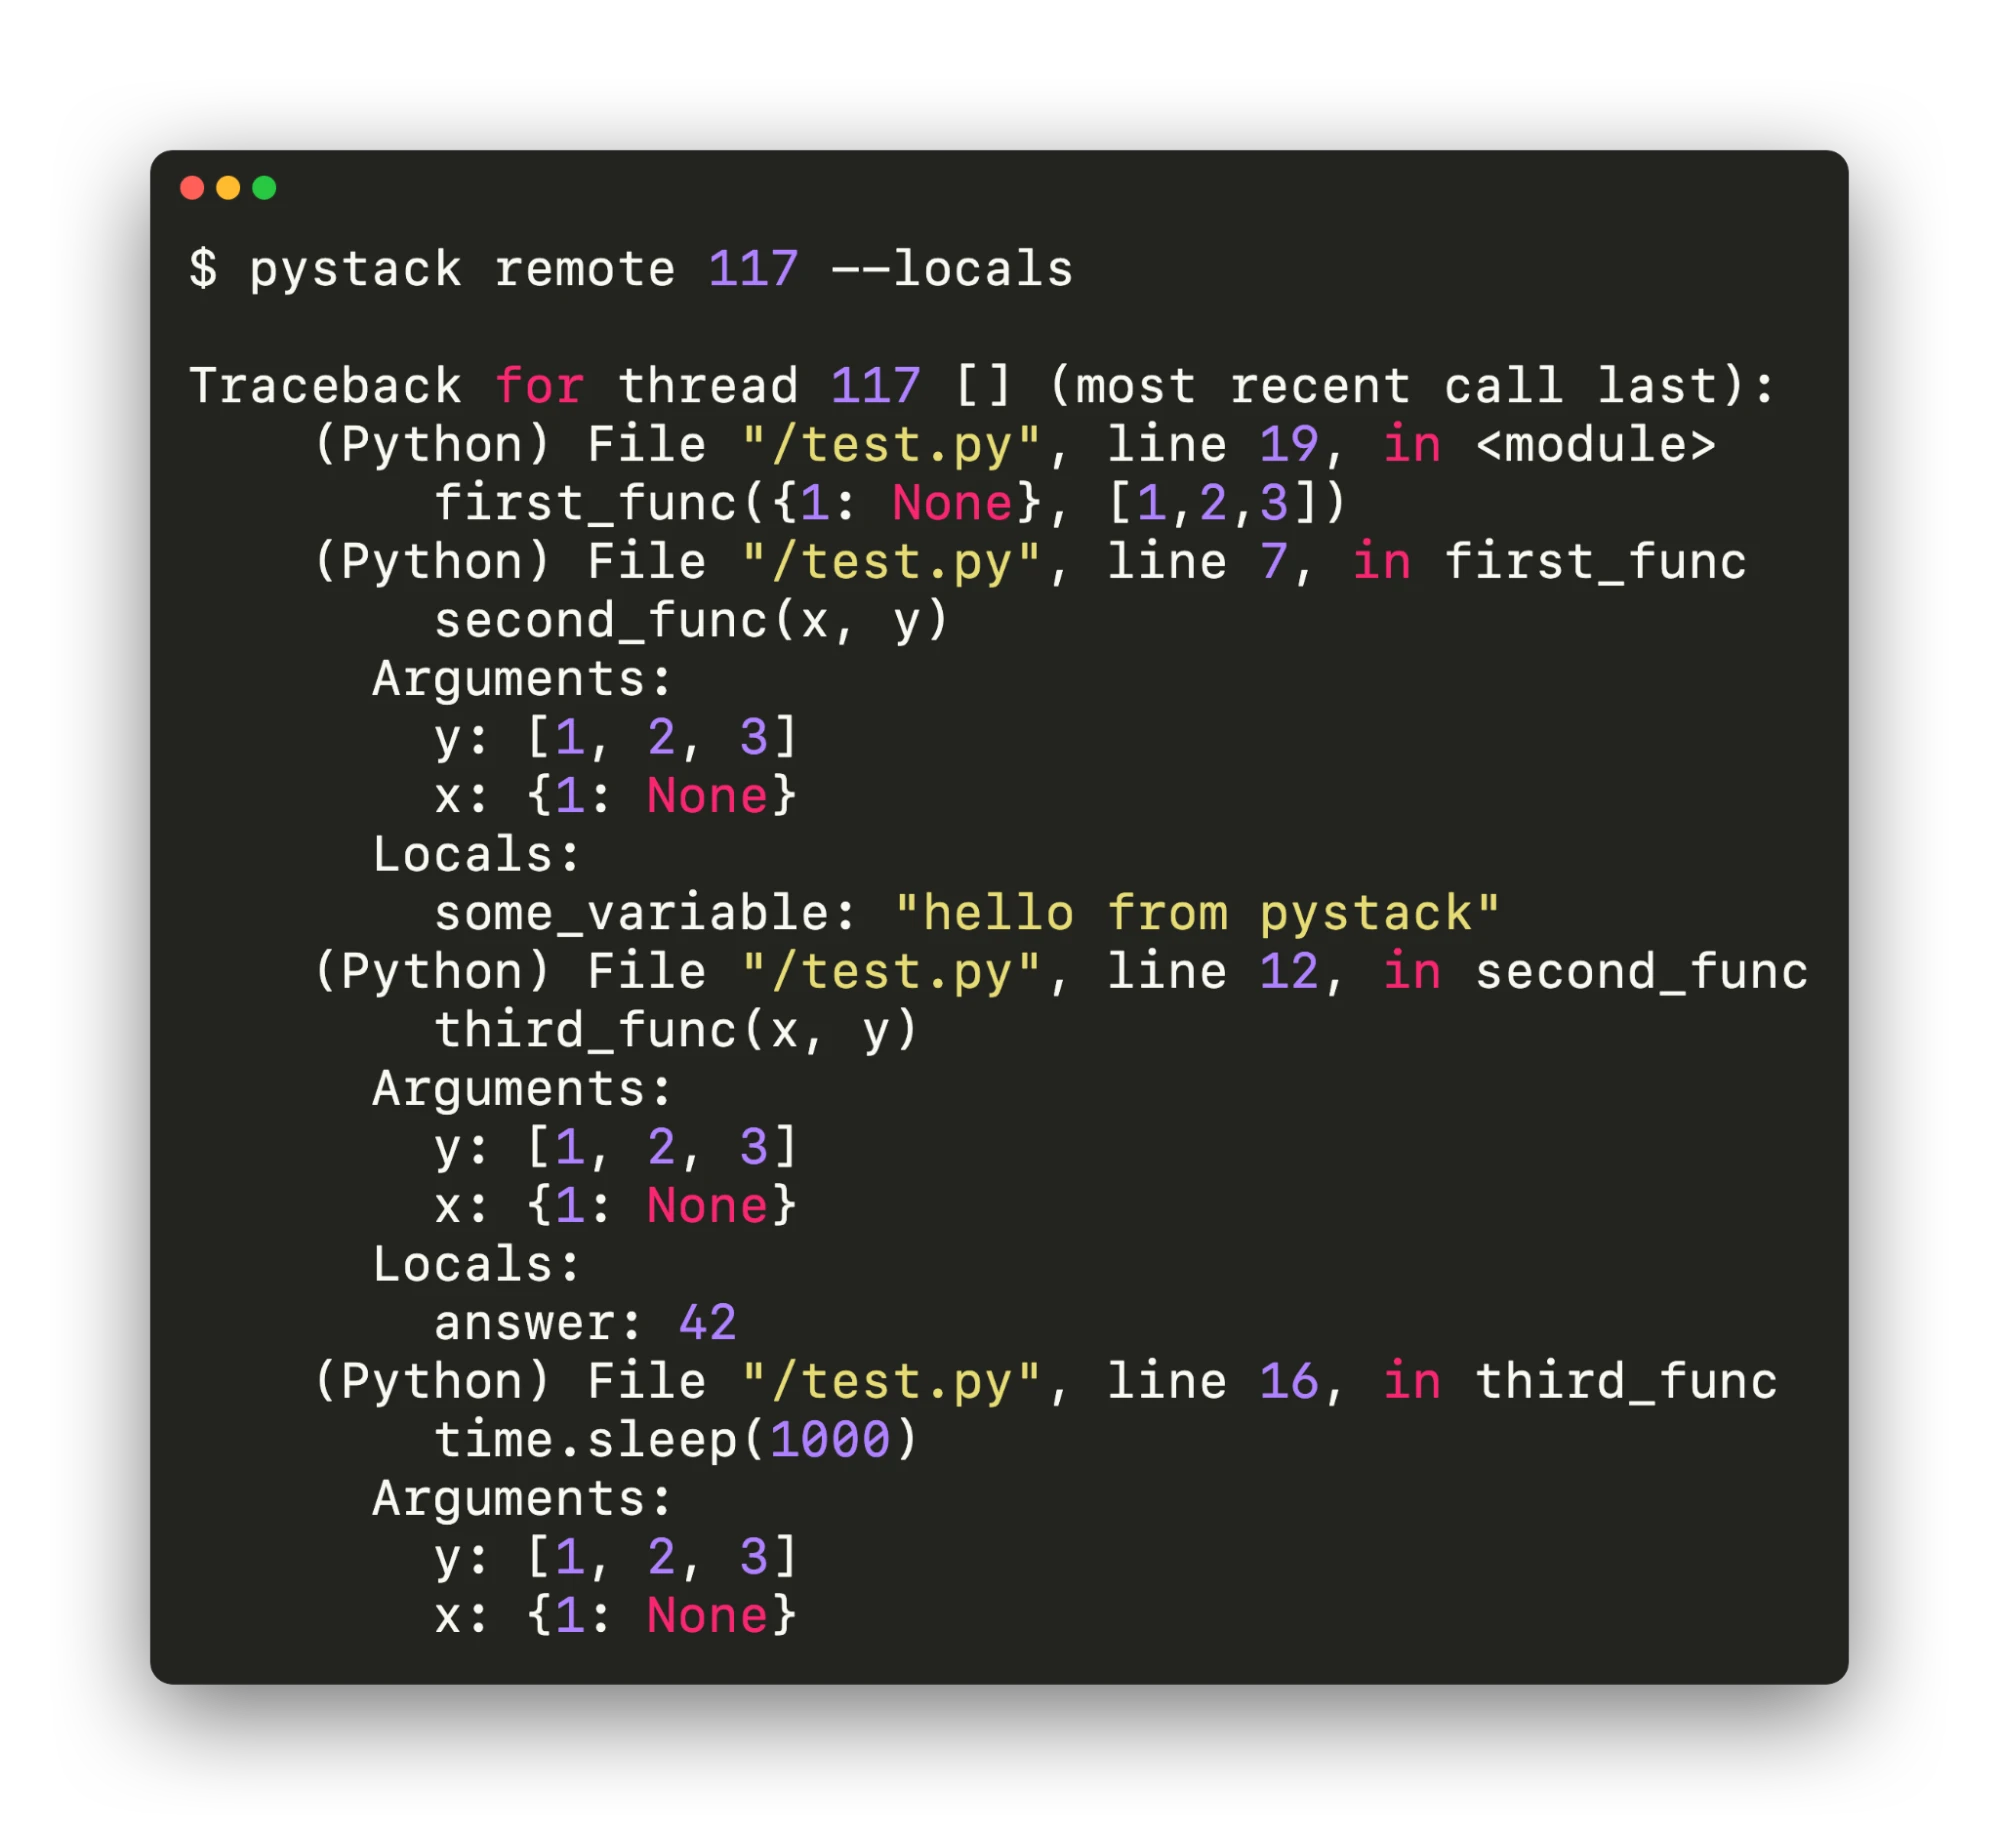
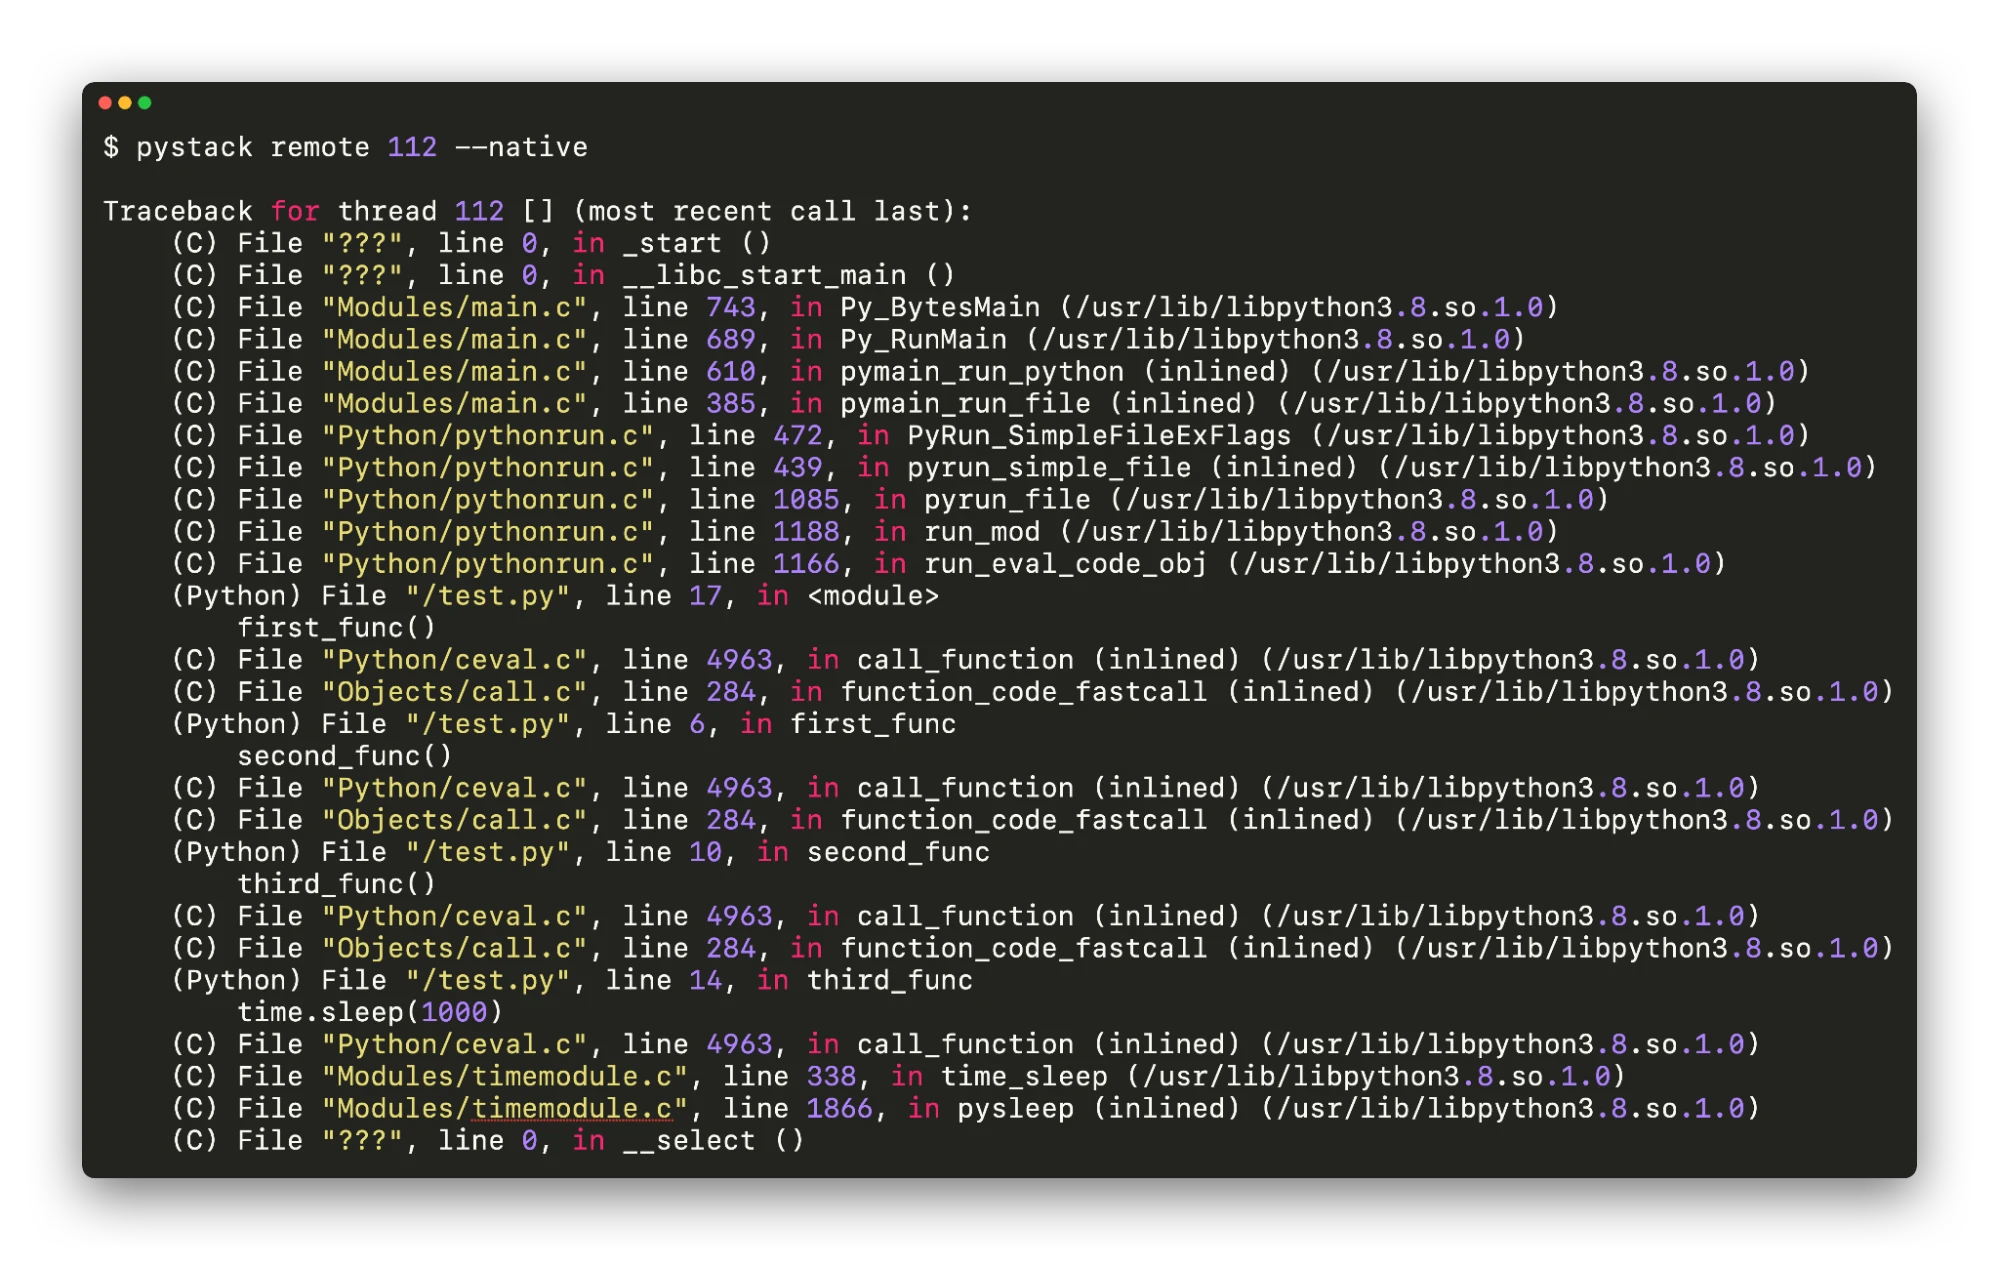
- 🐍 Optionally shows native function calls, as well as Python ones. In this mode, PyStack prints the native stack trace (C/C++/Rust function calls), except that the calls to Python callables are replaced with frames showing the Python code being executed, instead of showing the internal C code the interpreter used to make the call.
- 🔍 Automatically demangles symbols shown in the native stack.
- 📈 Includes calls to inlined functions in the native stack whenever enough debug information is available.
- 🔍 Optionally shows the values of local variables and function arguments in Python stack frames.
- 🔒 Safe to use on running processes. PyStack does not modify any memory or execute any code in a process that is running. It simply attaches just long enough to read some of the process’s memory.
- ⚡ Optionally, it can perform a Python stack analysis without pausing the process at all. This minimizes impact to the debugged process, at the cost of potentially failing due to data races.
- 🚀 Super fast! It can analyze core files 10x faster than general-purpose tools like GDB.
- 🎯 Even works with aggressively optimized Python interpreter binaries.
- 🔍 Even works with Python interpreters’ binaries that do not have symbols or debug information (Python stack only).
- 💥 Tolerates memory corruption well. Even if the process crashed due to memory corruption, PyStack can usually reconstruct the stack.
- 💼 Self-contained: it does not depend on external tools or programs other than the Python interpreter used to run PyStack itself.


In this conversation, we hear from Pablo Galindo Salgado (a member of the Python Steering Council and CPython core dev) and Matt Wozniski, two engineers on Bloomberg’s Python Infrastructure team who helped develop PyStack. We ask them why the tool was originally built, how Bloomberg engineers have been using it for the past few years, and what they hope the broader Python community will get out of and contribute to it.


Tell us about PyStack, the new open source project that you’ve published.
Matt: PyStack is the first tool I reach for when a Python program I’m developing gets stuck. When I’m expecting a program to do something and it doesn’t finish, I ask “why?” as my very first step debugging the issue. Is it making progress but taking longer than I expected, or is it stuck and waiting for something? If it’s waiting for something, is there a chance of the thing that it’s waiting for happening, or is it deadlocked waiting for something that can never occur? When the application’s logs don’t explain what’s happening, PyStack helps me answer those questions faster and with less effort than any other tool would.
How did you come to work on this project? Who else has contributed?
Matt: Until recently, I hadn’t been much of an active contributor to this project. While I’ve been Pablo’s backup on PyStack for a while now, that usually meant being a sounding board and code reviewer rather than writing much code myself. To do that, I needed to understand the big picture, but didn’t need much understanding of the low-level details.
However, I was recently tapped to help Pablo get this project ready to be published as an open source tool. As such, I’ve spent the last month or two learning and improving some of those low-level details.
Pablo: I started developing PyStack several years ago after I noticed that many of our engineers were struggling to identify why Python processes got stuck or what was happening that made them crash. At Bloomberg, we have a considerable amount of custom native code and C/C++ extensions that bind against Bloomberg native libraries that are called from Python code. This setup makes it especially challenging to use traditional tools to efficiently debug these types of situations, as they will typically only show you information about the native code, totally ignoring the fact that that code is being called from Python. This left our developers unable to identify what code paths were responsible for the problem, both in Python and native code.
To solve this problem, I created PyStack as a debugger that was focused on these particular problems. Furthermore, as many of our systems deal with core files – which present their own challenges – I also had to ensure that the tool was able to work with core files even if some of the supporting binaries were missing.


What did you individually contribute to the project? How did your experience and background prepare you to make this contribution?
Pablo: I designed PyStack, built the first prototype, shepherded the project to its first stable version, and have been maintaining it internally for a couple of years. I have a strong background in working with debuggers, compilers, and linkers, so that experience enabled me to efficiently design and prototype the initial version of the tool, as well as many of the features we have added through the years. By utilizing my expertise in writing Python C extensions and developing the CPython interpreter itself, we have been able to address several complex challenges in interfacing with the Python VM layer. This has helped us maintain the speed and flexibility of the tool, ensuring that it remains an effective solution for a variety of tasks.
Matt: As I said, my contributions were mostly bug reports and occasional design advice – until recently. In the run up to releasing PyStack as open source, I’ve participated in a flurry of activity: improving documentation, cleaning up the code base and test suite, replacing hacks with future-proof solutions, testing on more platforms, and fixing bugs uncovered by that extra testing.
My experience as a Memray maintainer has definitely enabled me to hit the ground running on this project. I’ve always enjoyed learning how things work at the lowest levels of the software stack, and both Memray and PyStack deal with “unwinding” a native call stack just like a debugger would. At this point, I can confidently state that I now know far more than the average developer about how debuggers work. Understanding how unwinding works, how Linux executables and shared libraries are mapped into a running process’ virtual address space, and how a process’ virtual address space is dumped to a core file are all key in making sense of the way PyStack comes together.


What problems does this solution solve inside Bloomberg?
Matt: We make use of a lot of CPython extension modules at Bloomberg in order to expose C++ libraries for use by Python applications. Bugs in extension modules can be particularly tricky to track down, because you need to wrap your head around state in multiple languages, and most debugging tools can only give you part of that state at a time.
A very common problem that we encountered, especially when we had less experience building extension modules, was deadlocks occurring in multithreaded applications, sometimes with extremely surprising root causes. I remember one example very vividly: an extension module was clearing a C++ shared pointer without dropping the GIL. This led to a C++ object’s destructor firing, which would then send a signal to a background thread asking it to wrap up and then wait for it to exit. That background thread tried to log that it was shutting down, which required picking up the GIL so that it could interact with the Python logging module. So, we deadlocked because the thread holding the GIL was waiting for the background thread to die, and the background thread was waiting to acquire the GIL before it would die. These sorts of issues are much easier to debug with PyStack since you can now see what all the application’s threads are doing, whether Python or C++ or a mix of both.
How will this solution benefit the broader open source community? Why does the Python community need a tool like PyStack?
Pablo: Since the inception of the tool many years ago within Bloomberg, there has been quite a lot of development in the area of stack samplers for Python. Many of these tools are profilers that center on measuring which functions are responsible for the time it takes to run a certain application. Incidentally, many of these tools share similar capabilities with PyStack (including the possibility of retrieving hybrid native/Python stacks), as they also need to be able to retrieve and print Python stacks for profiling. While these tools are fantastic and have helped the community immensely, PyStack focuses mainly on the debugging aspect, which provides a different set of balance.
For instance, PyStack puts a lot of effort in ensuring that the stack can be retrieved even in the most dire of situations, including when core files are corrupted or missing complementary binary information. In addition, PyStack provides a lot of extra information around the state of the runtime that is focused on the debugging aspect (as opposed to performance-oriented metadata). This makes PyStack a tool that really complements other similar tools in the community, and it will ensure that tools like profilers and debuggers that need to retrieve stack information will continue to be in a healthy state, along with good integration with the Python interpreter.
Matt: For the same reason Bloomberg does! Being able to figure out what a running program is up to is an invaluable debugging tool when something isn’t behaving as you expect it to. Furthermore, being able to figure out what a program was doing when it crashed is even more valuable.
While it’s possible to see this using a debugger like GDB (especially with GDB’s Python extensions, which allow you to get the Python stack using `py-bt`), using GDB for this is slow, heavyweight, and totally alien to Python developers who have never needed to debug native code. On the other hand, PyStack is an easy-to-use, single-purpose tool for answering “what functions is this process running?”, which is often the very first question you need to answer when tracking down why something is broken.
What do you hope the community contributes to the project?
Matt: Bug reports, and possibly even bug fixes. Until very recently, PyStack had only been tested on a relatively small number of environments – only against the Linux distributions and interpreters that we make use of at Bloomberg. We anticipate the community will find edge cases that we’ve never experienced or needed to consider, and we plan to leverage those reports to make the tool more robust and future-proof.
Pablo: We expect the community to help us shape the direction of the tool by suggesting new features and approaches to get even more visibility into their applications in ways that makes it much easier for them to understand the root cause of problems such as deadlocks and crashes. We also look forward to collaborating with authors of similar tools in this space to develop common solutions and approaches that will allow profilers and debuggers for CPython to really thrive and be much easier to maintain in the future.
