Bloomberg publishes Memray, a new open source memory profiler for Python code
April 27, 2022


Bloomberg’s Python Infrastructure team supports the more than 3,000 engineers at Bloomberg who write code using the Python programming language. The team provides critical infrastructure to ensure that every one of our developers has an optimal programming experience. This team also delivers cross-platform Python runtimes, feature parity for the company’s proprietary toolkits, libraries, and frameworks, as well as classes to train our team to leverage open source libraries like pandas and other infrastructure tools.
One of the tools the team developed is Memray, a memory profiler for Python on Linux that can help developers analyze allocations in applications to help reduce memory usage, find memory leaks, and identify hotspots in code that cause a lot of allocations.
Leading up to PyCon US 2022, the team published Memray as an open source tool so that Python developers worldwide can use it to track memory allocations in both Python code and native extensions. The tool, which has already garnered lots of attention (see the tweet below from Yuri Selivanov, a prominent CPython core developer, and this post on the r/Python subreddit), generates various reports to help analyze memory usage in libraries and applications, and it can also be used as a CLI tool or as a library to perform more fine-grained profiling tasks.
Some notable features
- 🕵♀ Traces every function call so it can accurately represent the call stack, unlike sampling profilers.
- ℭ Handles native calls in C/C++ libraries so the entire call stack is present in the results.
- 🏎 Blazing fast! Profiling causes a minimal slowdown in the application. Tracking native code is somewhat slower, but this can be enabled or disabled on demand.
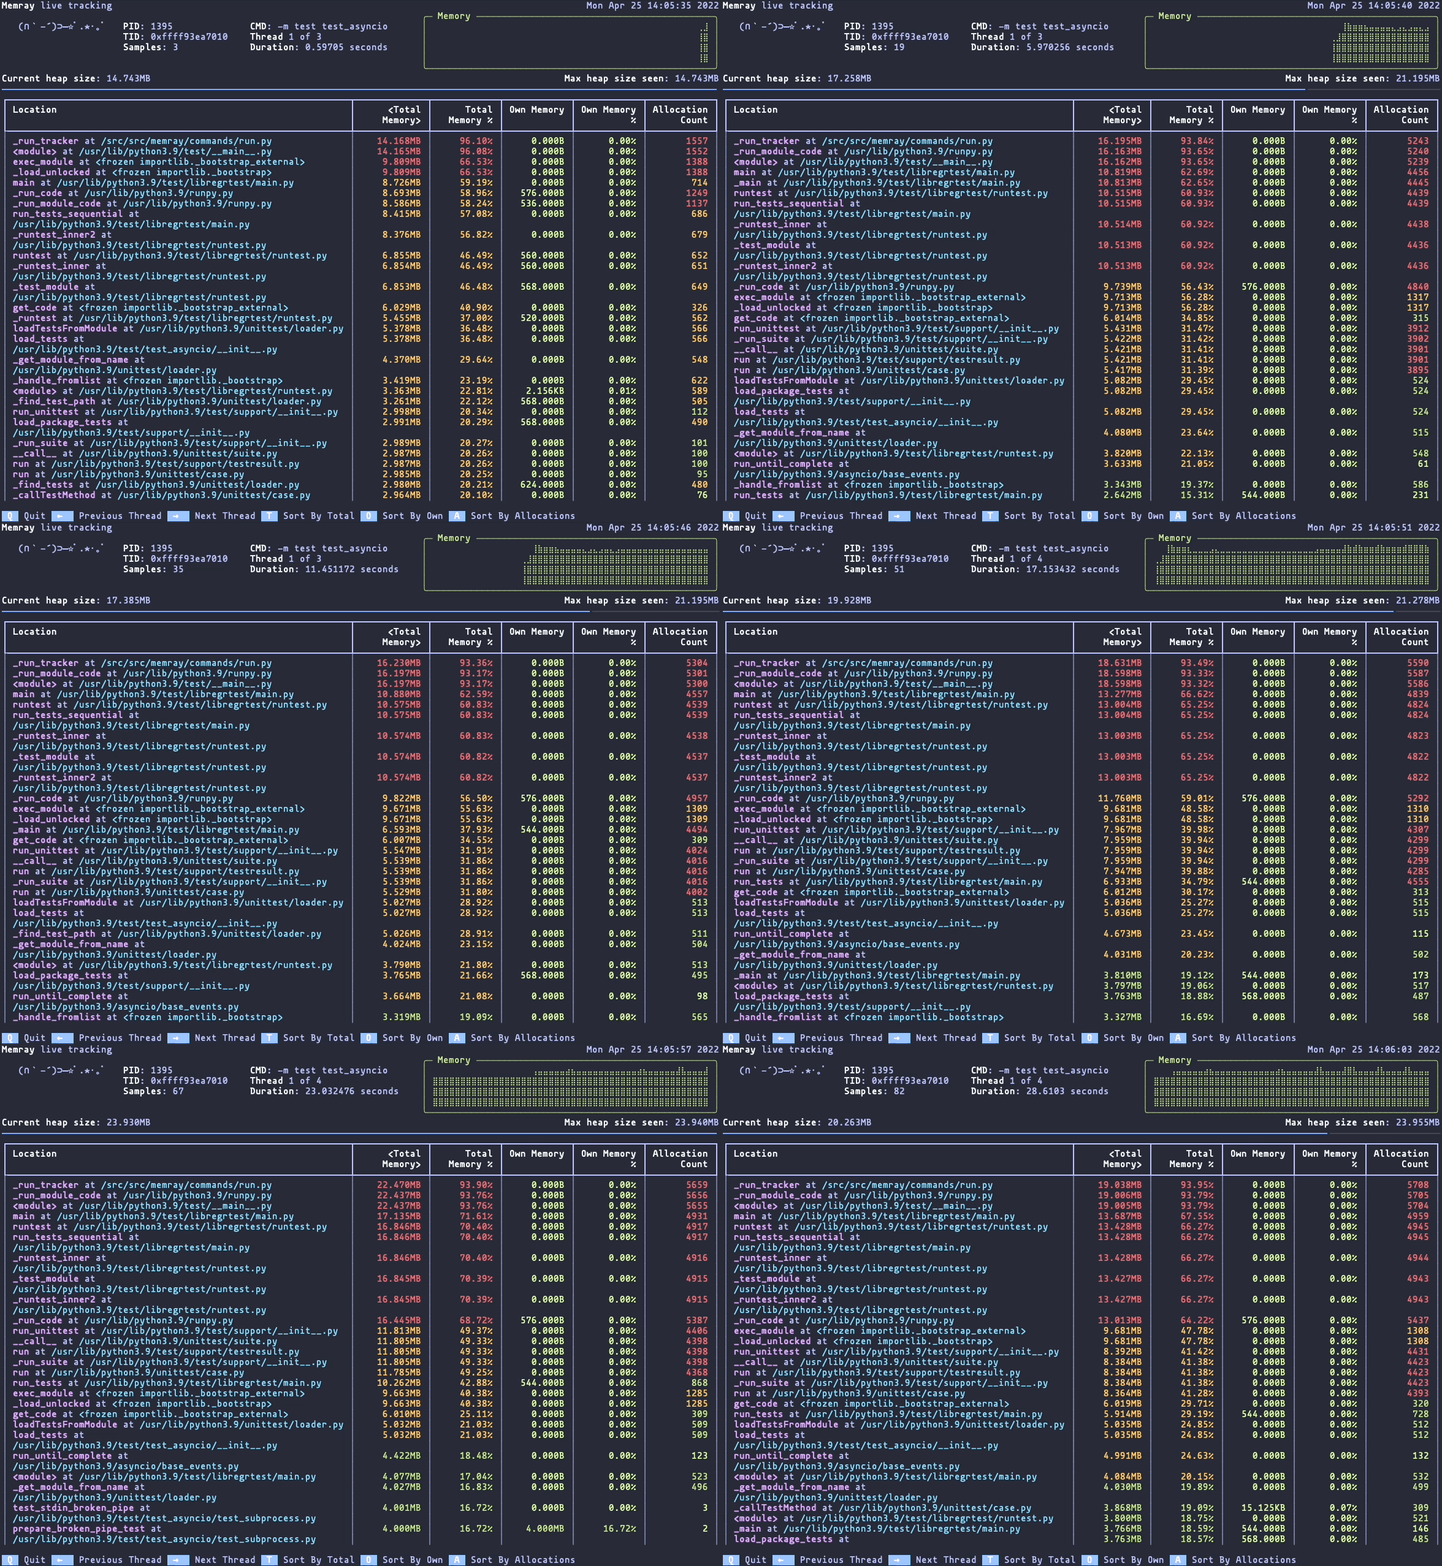
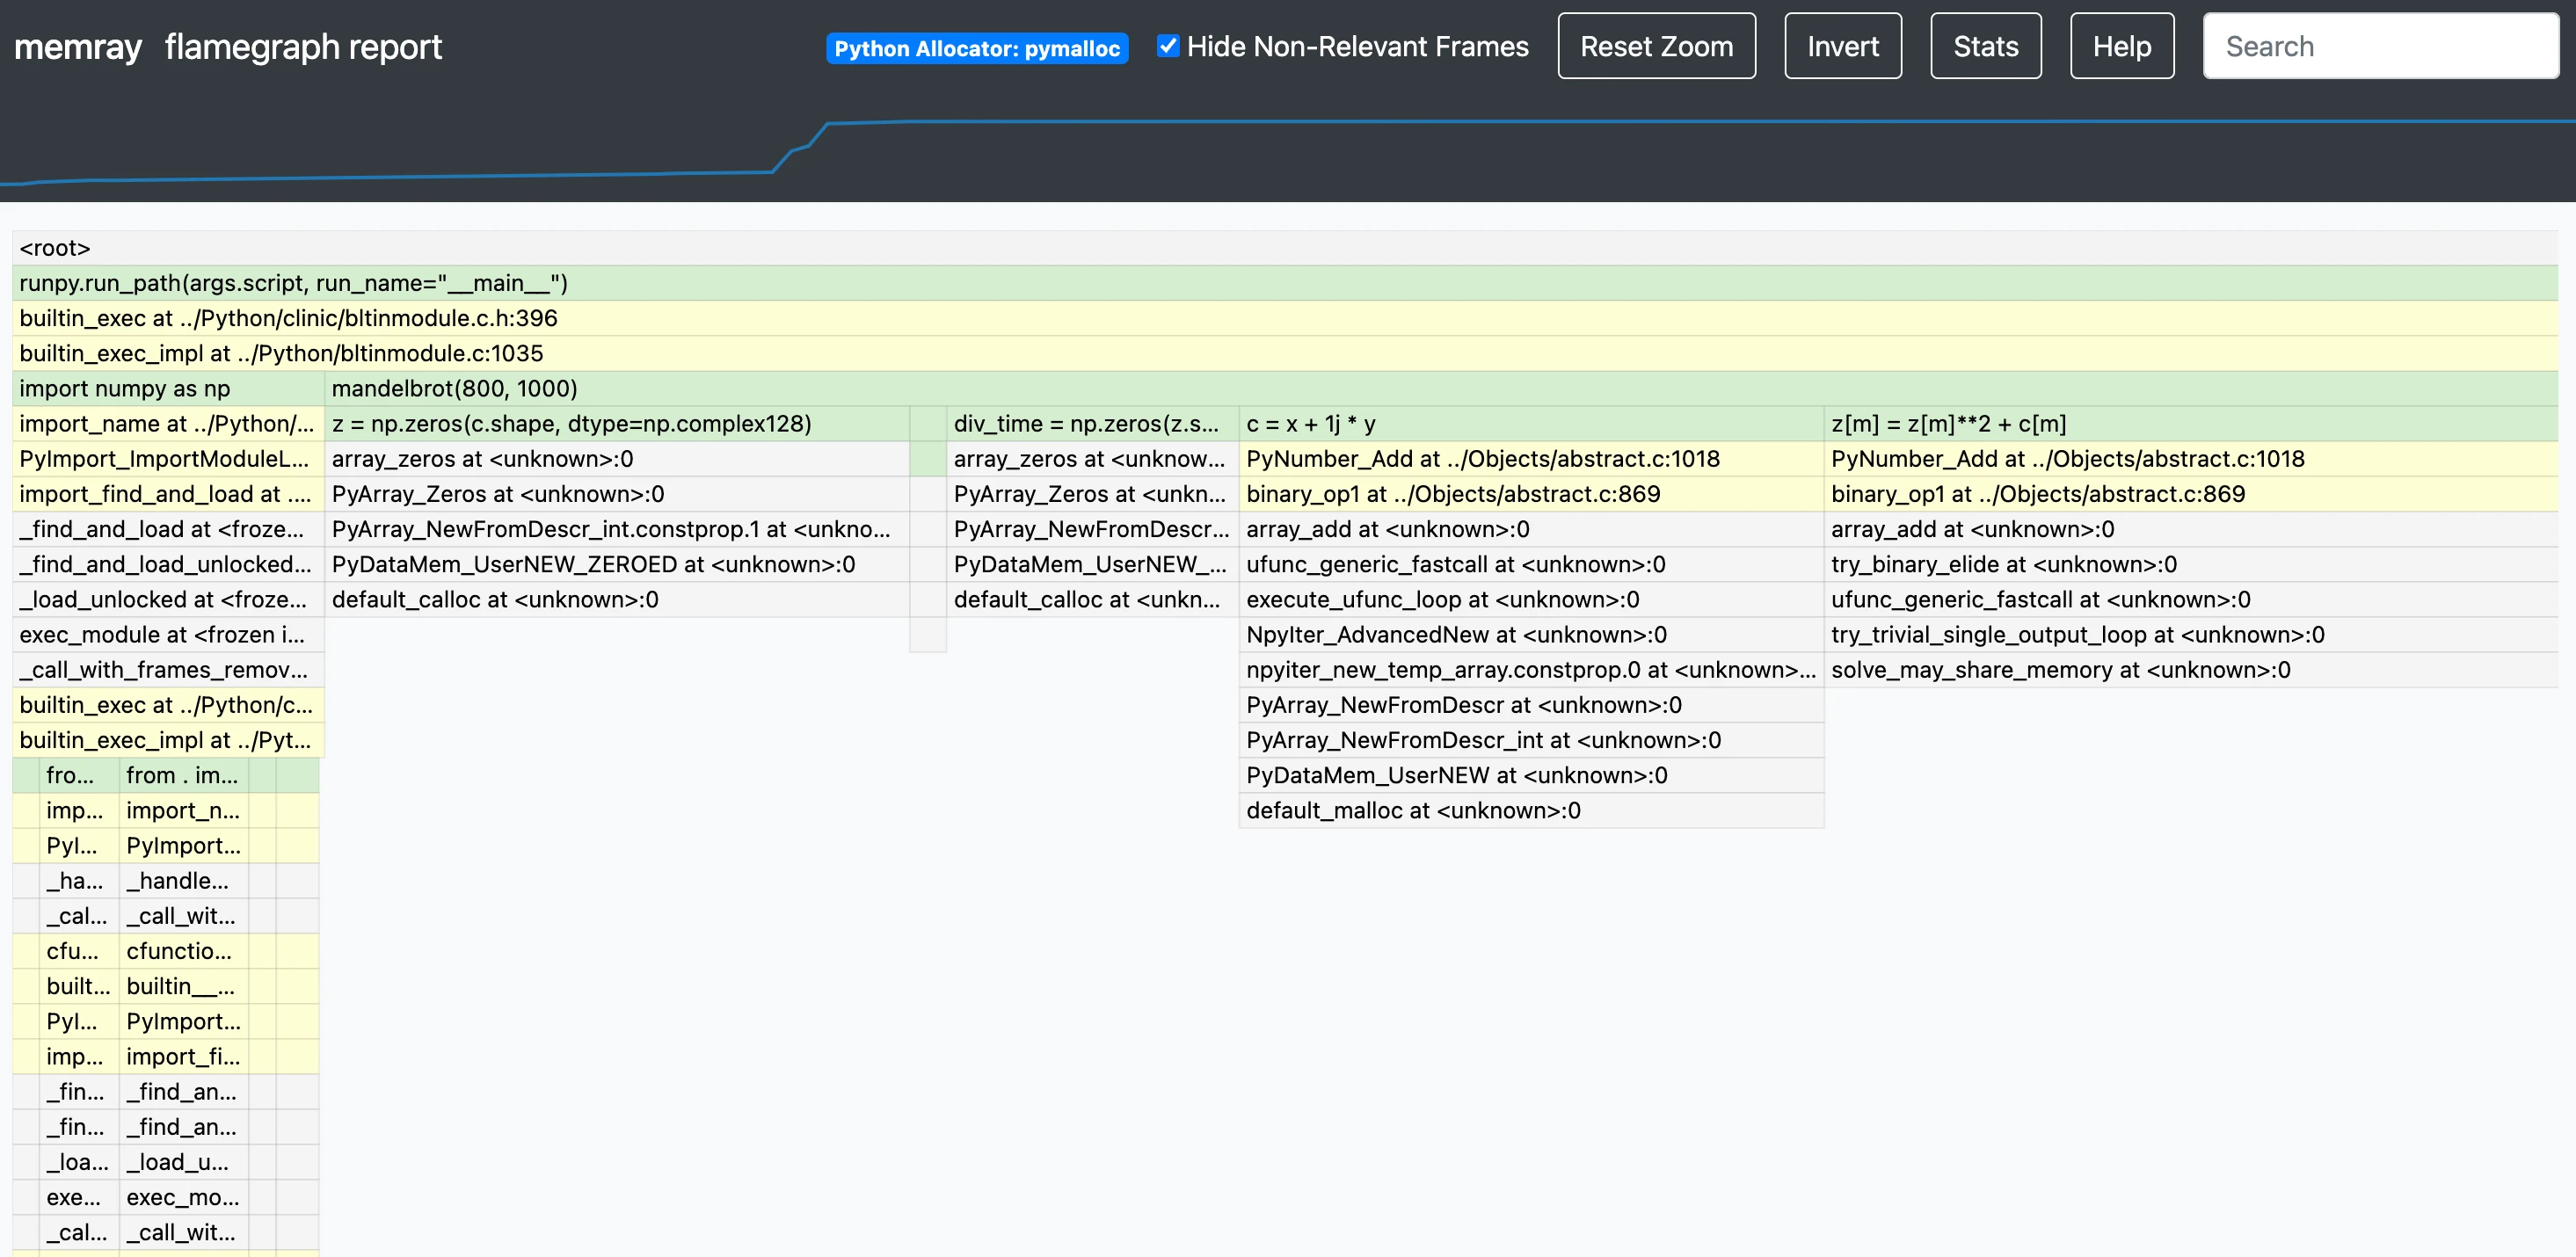
- 📈 It can generate various reports about the collected memory usage data, like flame graphs, as well as graphs of the memory usage over time by a process.
- 👽🧵 Works with both Python and native threads (e.g., C++ threads in C extensions).

Compared with existing memory profilers, Memray offers the following advantages:
- It’s super fast: the core of the library is in C++ and it binds against CPython using domain-specific interfaces.
- Works with native threads that allocate outside the Python interpreter.
- Tracks Python allocations (objects created by the interpreter), native allocations (calls to malloc(), C++ allocations, etc.), and resident size at regular intervals.
- Gathers a huge amount of data to a file, so different specialized reports can later be generated from it.
- Can be activated and deactivated at runtime on specific regions of code so your application doesn’t slow down in the areas where you are not using the profiler.
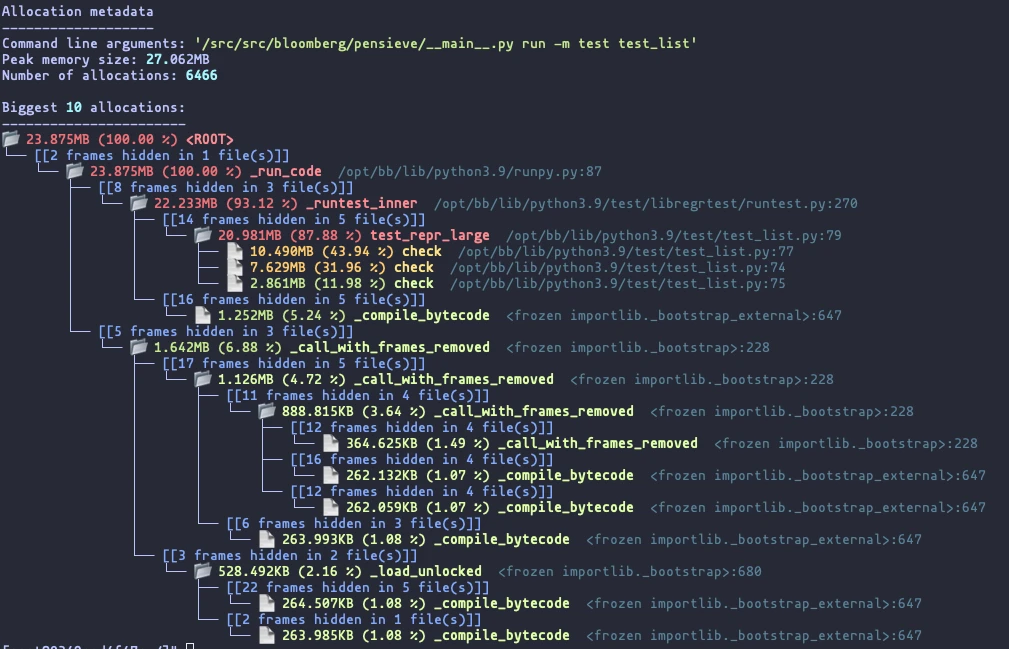
- Shows you the merged Python/C/C++ stack for every allocation, allowing you to understand how memory is allocated in native extensions.
In this conversation, we hear from Matt Wozniski and Pablo Galindo Salgado, two members of Bloomberg’s Python Infrastructure team who helped develop Memray. We ask them about the tool, why it was originally developed, how Bloomberg engineers have been using it, and what they hope Python developers in the community at large will get out of it.


Briefly tell us about yourself in a few sentences.
Matt: I’m a senior software engineer working in Bloomberg’s Python Infrastructure team. I started at Bloomberg in 2009 doing application development for our equity analysis tools, and I’ve had a few different roles in the company since then, including a stint as the co-chair of our Python Guild. I joined the Python Infrastructure team in 2019. I work on low-level tools like Memray, as well as Python bindings to internal libraries written in other languages, like C++. I see my job as helping make other software engineers at the company more productive – a job that requires as much time talking to people and helping them design or debug things as actually writing code myself. When Bloomberg publishes something Python-related as open source, I’m often one of the lead reviewers, and I spend a lot of time offering design expertise to other teams, and especially other infrastructure teams, within the company.
Pablo: I’ve been working at Bloomberg for six years and now work in the Python Infrastructure team. Before joining Bloomberg, I was working in academia doing my Ph.D. researching rotating black holes and general relativity. I work on a multitude of different things, but I normally tend to focus on low-level tools that can help other programmers do their job more efficiently. As a CPython core developer, I also spend a considerable amount of time contributing to CPython, the default implementation of the Python programming language. I am currently serving on the Python Steering Council and am also the release manager for Python 3.10 and Python 3.11.


Tell us about Memray, the new open source project that was published.
Pablo: Memray is a memory profiler for Python applications – with some twists. The landscape of profiling tools in Python is a very rich and vibrant ecosystem, where you can already find a considerable number of different solutions. This project specifically focuses on some areas that are notably complicated, and which the vast majority of existing solutions do not cover.
One of these areas is the ability to profile the memory utilization of mixed Python and native C/C++ code, while also offering introspection capabilities that show how the different layers intertwine. So, when you are inspecting the results of the memory profiling, you are also able to see when your application is running Python code or native code as part of a single, integrated report. You can see function names, file names, and other information both in native code and Python simultaneously, which is a game-changer when you need to debug C extensions.
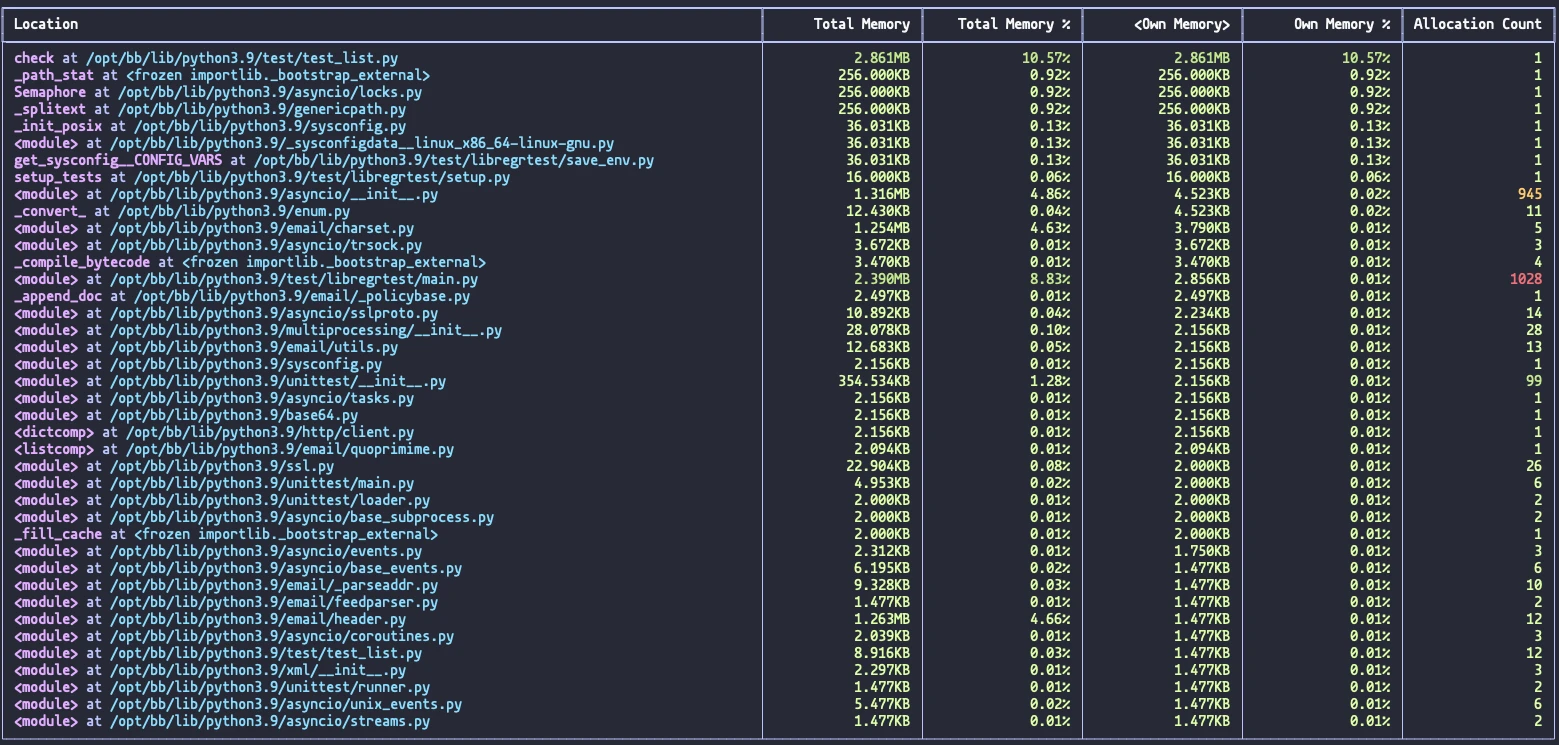
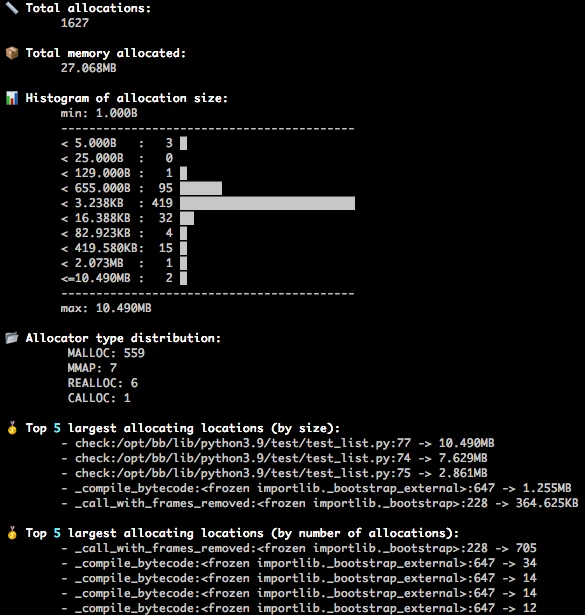
There are also some other areas where our profiler shines. Many profilers can only produce a single kind of report, but we have a different approach. Our profiler captures all the raw information about your application’s allocation patterns and produces a data dump that can be analyzed later with different tools. This way, you can produce many different reports and views of the data. This means that you can run it once and analyze it in many different ways, providing an easy way to get different kinds of information from the same data.
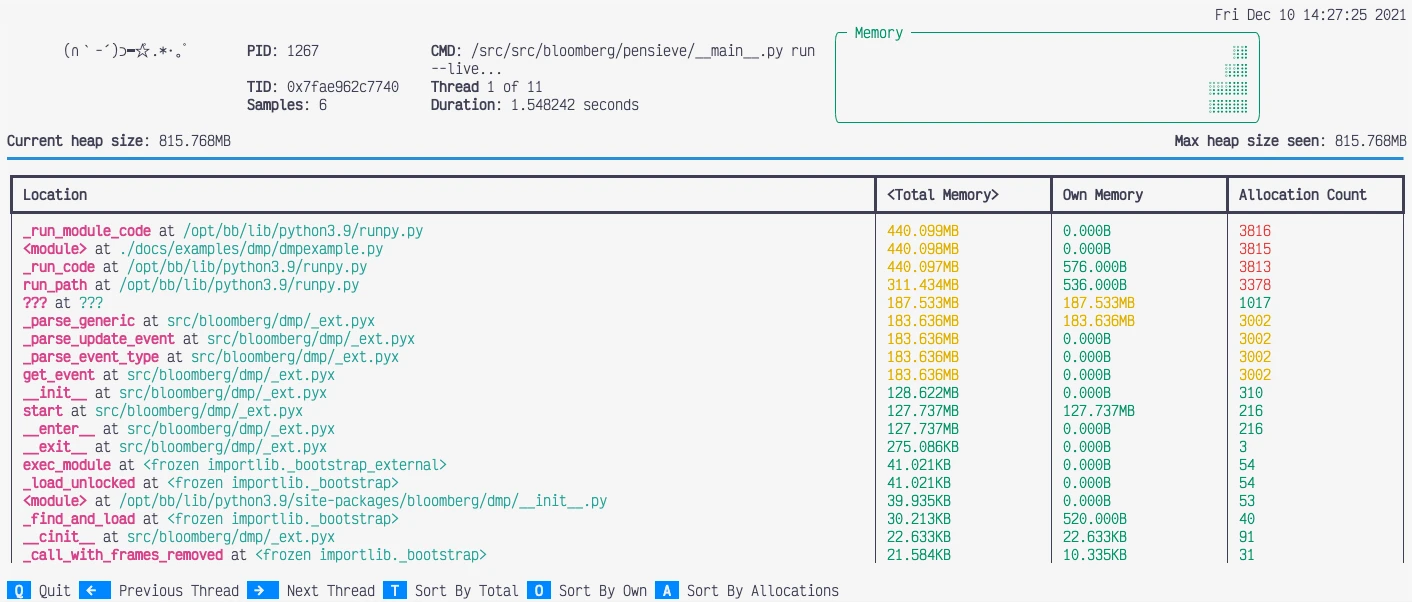
Matt: In addition to what Pablo said, I’ve got to point out that live mode (memray run --live) is incredibly cool. The ability to watch how the memory usage of a Python program evolves in real time as it runs can give you some great insights into what memory is being quickly reclaimed and what isn’t, which operations might need a lot of temporary memory, and other things like that. Watching what the program is doing while it’s doing it can give you some interesting insights that would typically be much harder to gain in any other way.

How did you come to work on this project? Who else has contributed?
Matt: I got pulled into this project in the run-up to its being published as open source. Over the last few months, I’ve been polishing and helping cross off some features on our wish list. Before then, the only things I had contributed to the project were code reviews, feature requests, and some occasional design advice. The initial proof of concept and design for this profiler was Pablo’s. Pradyun Gedam and László Kiss Kollár respectively contributed the front-end and back-end support for “live mode.”
Pablo: A couple of years ago, our internal users at Bloomberg were unsatisfied with the available options for memory profilers and asked our team to provide or recommend a solution that could cover the specific problems that Bloomberg’s developers face. After doing some user studies, researching the current landscape of profilers, and analyzing the situation, we decided that there was room to develop a new kind of profiler that would leverage our expertise in Python, Linux, ELF, DWARF, and low-level systems programming tooling.
In addition to contributions from many members of our team, we also received some InnerSource contributions from other people across the company, including Subbrammanian Nochur Ganeswaran, who contributed a new reporter to the tool.

What did you individually contribute to the project? How did your experience/background prepare you to make this contribution?
Matt: While I only really started contributing to this project in earnest this year, the single biggest feature I contributed was the ability to optionally continue tracking child processes forked from the tracked process. A lot of my contributions have been polishing things. I redesigned how Python frames are tracked in a way that resulted in output files being 80% smaller and tracking having about 10% less overhead. I sped up the parsing of captured records by about 50%, which makes a huge difference in “live mode” being able to keep up with the firehose of data it’s receiving. I’ve also committed a ton of time to code reviews for features written by others.
Pablo: I have contributed to the project since its inception. I did the technical design, user studies, planning, and built the first working prototype and first internal implementation of the tool. Since then, I have implemented many new features and optimizations, while focusing on the vision for the tool and its roadmap. My background working with compilers and linkers has helped me enormously in the design phase, as it enabled us to offer very flexible and powerful interfaces that require no modification as to how the user code is executed. In addition, my expertise in writing Python C extensions and my experience developing the CPython interpreter itself have allowed us to overcome many complicated challenges while interfacing with the Python VM layer in order to keep our tool fast and flexible.

What problems does this solution solve inside Bloomberg?
Matt: Once upon a time, everyone used 32-bit processes, and if your interpreter tried to use more than 3GB of memory, the kernel would happily kill it and leave you with a core file to investigate. Those days are long gone. Today, on modern server hardware, it’s entirely possible to accidentally write a program that consumes 100GB of memory and works fine – except it makes everything else on the box slow.
I’ve been pulled into projects before to figure out how to speed up an application or how to make it use a more reasonable amount of resources. Giving developers tools that they can use to easily investigate what their application is doing is a huge win, especially since the solution to fixing some scaling issue often turns out to be obvious if you can just put your finger on what the problem is.
Pablo: Bloomberg engineers work with a lot of Python code, but this Python code very often calls into native extensions. These extensions can be very different in nature, ranging from classic packages from the Python numeric ecosystem (like NumPy and pandas) to high-performance Bloomberg-specific networking middleware written in C++.
The inner workings of these extensions have an enormous impact on different aspects of the lifecycle of Python programs at Bloomberg, including performance, memory usage, and allocation patterns. It is often impossible to understand how one of our Python applications is using memory without first understanding what’s going on in these C/C++ layers, as well as how these layers interact with the Python interpreter itself. For this reason, having a **unified** vision of how the different allocation patterns from Python and C++ integrate with one another has been one of the most impactful features that our profiler offers, as it allows developers to obtain exactly the data they need in a comprehensive and intuitive way. And it doesn’t matter whether they are application developers using these native extensions underneath their code or C++ extension developers who need to understand how the memory allocations in their native extensions impact their users.
Plus, the ability to offer different reports and views from the same report file also gives our users the flexibility to choose exactly the view that they need to solve their specific problems. It doesn’t matter if they are trying to find out how an application is using too much memory, discover where memory leaks are, or understand the statistical summary of allocation patterns.

How will this solution benefit the broader open source community?
Matt: There are some great open source profilers available to figure out where a Python program is spending its time. However, there haven’t been many great solutions for figuring out where a Python program is spending its memory, especially when that memory is allocated by a native extension module. My hope is that the next time someone wonders why a script is using so much memory, they’re able to figure it out without needing to change anything about their program besides how they run it. We hope the visualizations we provide for this data make it easy to understand and analyze, and the transparency into what native extension modules are doing under the covers helps paint a much more complete picture than you would otherwise be able to see.
Pablo: This solution will be beneficial to the open source community in the same way it is beneficial to Bloomberg. Although we are very heavy users of native extensions, this situation is actually very common, especially in the data science space, where many users leverage the power of popular tools that have or use native extensions (such as pandas, NumPy, SciPy, etc.). Furthermore, there is a considerable amount of code that includes native extensions made with Cython, plus it is quite popular these days to also provide Rust extensions modules. For both developers of these extensions and their users, it is paramount to be able to get information in a transparent way that properly reflects how the Python code and the extension code interact. In this regard, being able to not only understand how the Python interpreter is requesting memory, but also how the native code does so will allow users to have a very thorough and reliable view into the allocation patterns of their code.
Our approach, which provides the ability to generate different reports from the same data dump generated by the profiler, will also provide different communities and user groups the opportunity to obtain different views specific to their own data or domain problem. So there is always the possibility of extending the tool to generate new reports they may need.

What do you hope the community contributes to the project?
Matt: I’d like to see interesting ideas about data we could be utilizing but aren’t, more useful ways to analyze the collected data, or new questions the tool can’t answer today. Memray collects a huge amount of information about a program, so figuring out useful things to do with that data is limited only by our imagination. I’m interested to see what features others can dream up for this tool.
Pablo: We hope the community finds this tool as useful as our developers do and that they use it to solve their memory-related problems. We also encourage the community to help us shape the future and direction of the tool by letting us know what specific problems they are facing and how we could extend or modify our tool to solve them. In addition, we hope that contributors will help us add new reporters that adapt to problems that we have not yet considered, and that they extend the tool to work on systems that we have not initially supported.
