Bloomberg Market Specialist Li Zhao contributed to this article. The original version appeared first on the Bloomberg Terminal.
Background
Several technical indicators suggest that the U.S. stock market reached its top last year as equity prices have swung wildly.
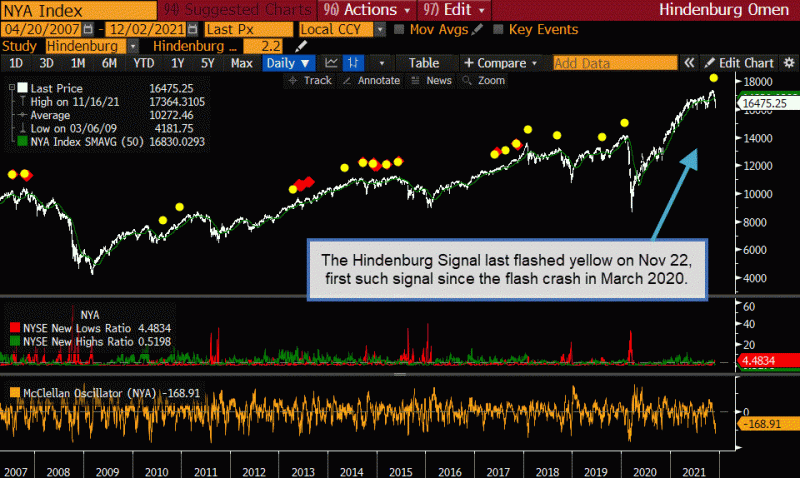
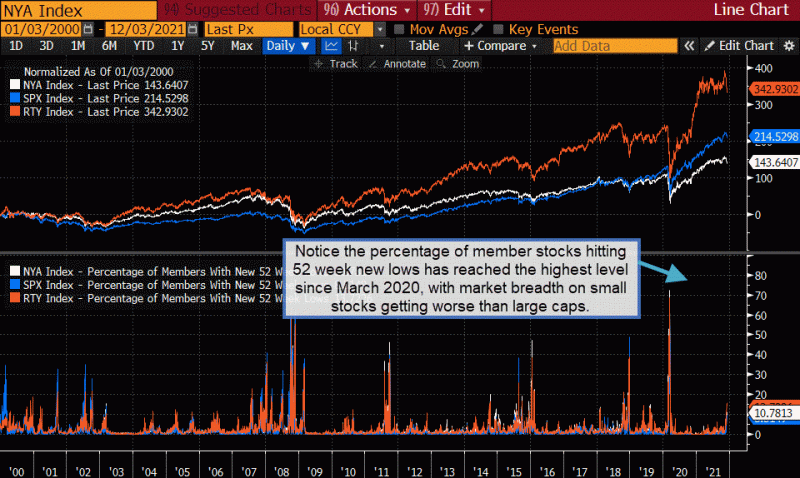
In November, for example, the Hindenburg Omen, a technical indicator designed to predict severe equities declines, flashed a warning of an increased potential for a decline in the New York Stock Exchange Composite Index. The percentage of stocks in major U.S. benchmarks hitting 52-week lows jumped to the highest since March 2020 just as relative strength indicators weakened.
The issue
The Hindenburg Omen flashed yellow on Nov. 22, the first such signal since the market swooned 34% in early 2020.

The indicator identifies polarization among the constituents of the exchange that may infer a market correction is nigh. That signal has been happening less frequently in recent years. Nonetheless, the yellow signals in 2018 and 2020 proved to be prescient for market corrections.
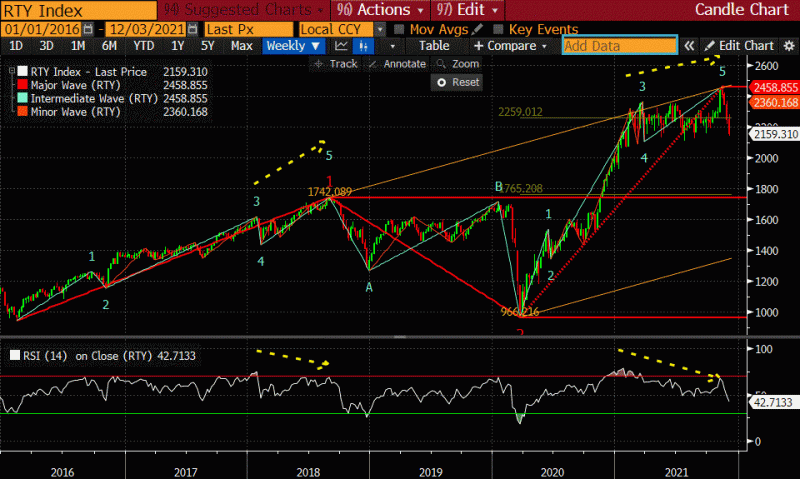
The Hindenburg Omen isn’t the only technical indicator that may have presaged the current market decline. Elliott Wave proposes that progress is made with trends consisting of five waves (labeled 1 to 5) and counter-trend corrections of three waves (labeled A to C). In hindsight, a rally in early November was a false breakout, known as a bull trap. The Elliott Wave counting tool shows a five-wave uptrend since March 20, 2020, with a final fifth wave in progress.

Meanwhile, the percentage of New York Stock Exchange Composite Index stocks hitting new 52-week lows is at levels unseen since March 2020, which signaled the last correction. Market breadth on small-company stocks is getting more extreme than large-company ones.
Bloomberg’s charting and market breadth tools can help investors analyze the stock market’s technical indicators.
Tracking
Use Natural Language Charting function to see the percentage of 52-week lows across major indexes.

For more information on this or other functionality on the Bloomberg Professional Service, click here to request a demo with a Bloomberg sales representative. Existing clients can press <HELP HELP> on their Bloomberg keyboard.